The 65th Hatch Awards
One of the oldest, most prestigious and well-known regional marketing creative awards in the country, the Hatch Awards celebrate the incredible marketing work developed here in the region. Entries were evaluated by a panel of creative leaders from across the U.S. The selected award-winning work showcases the region's excellence in creativity.As of November 13, 2026 · Campaign still ongoing. Results reflect performance to date.
Campaign Overview
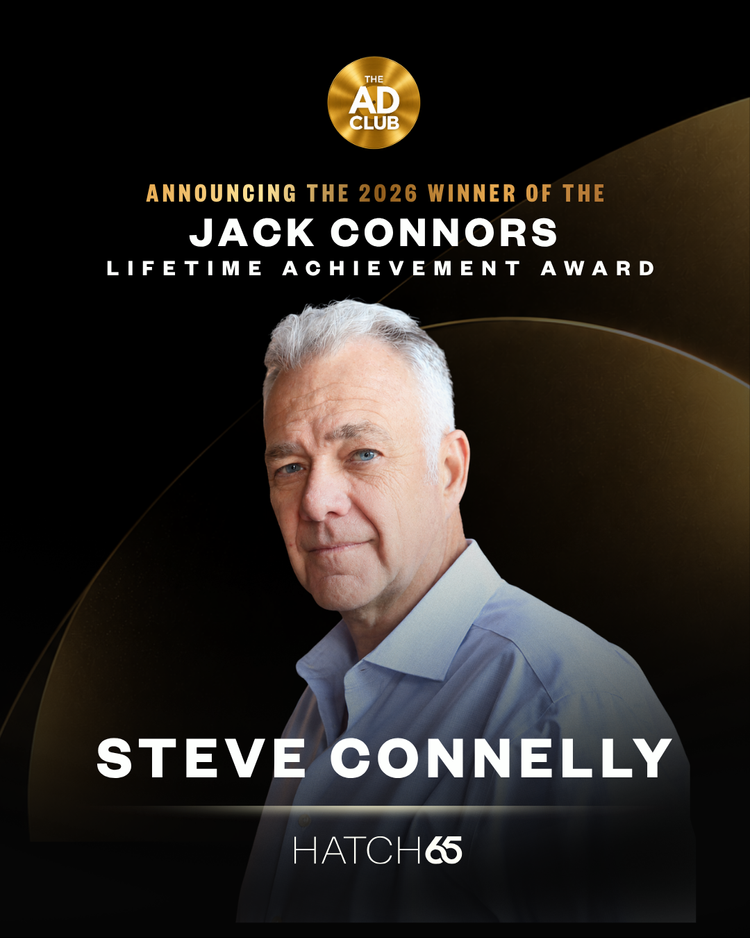
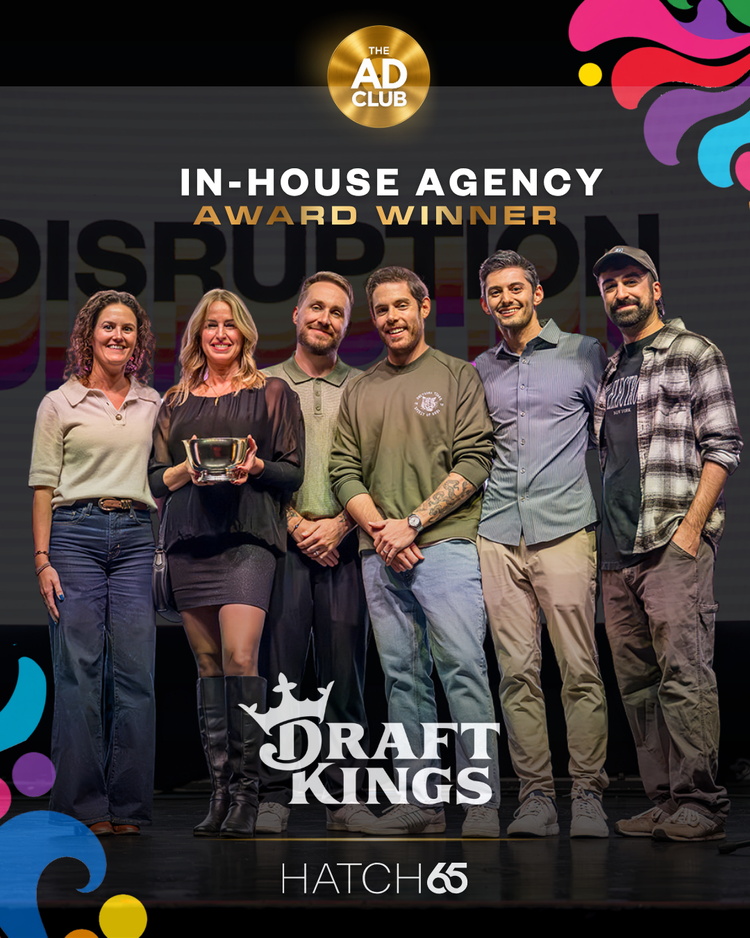
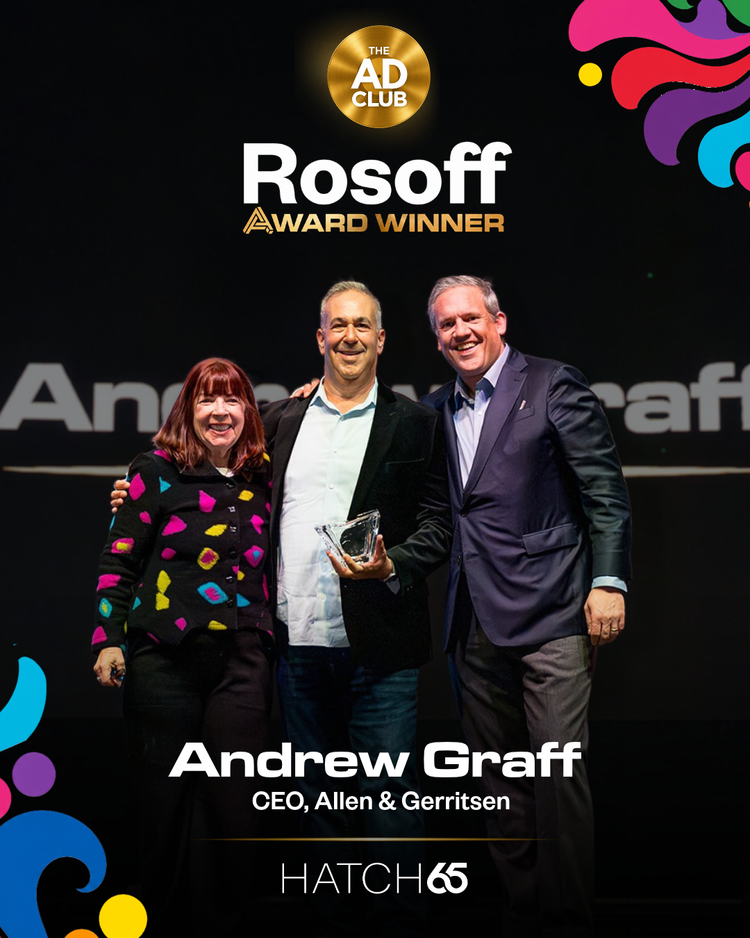
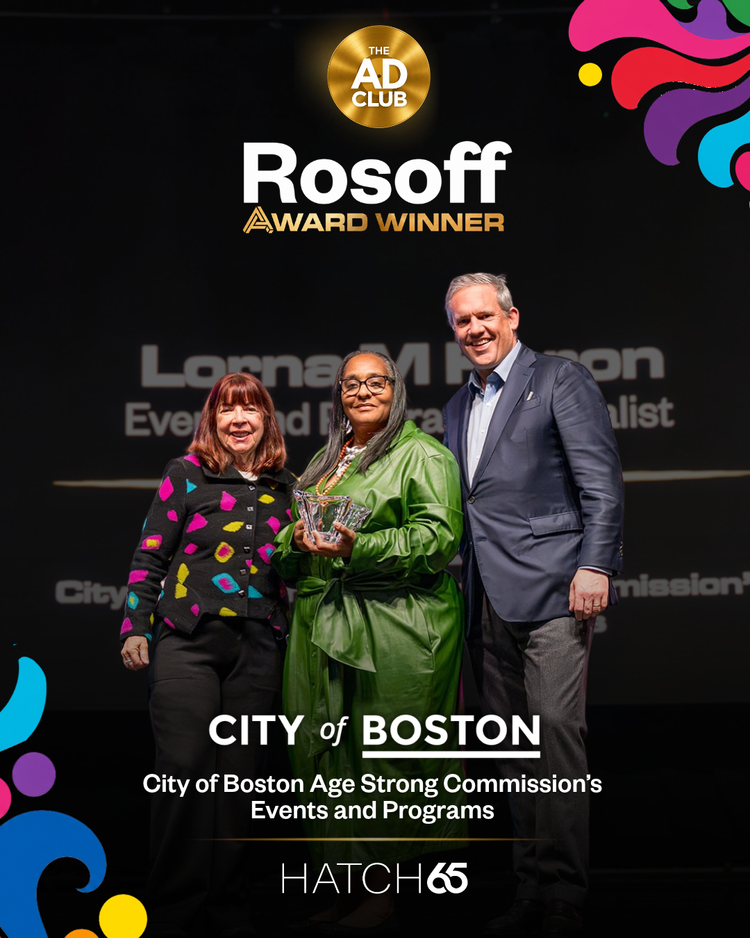
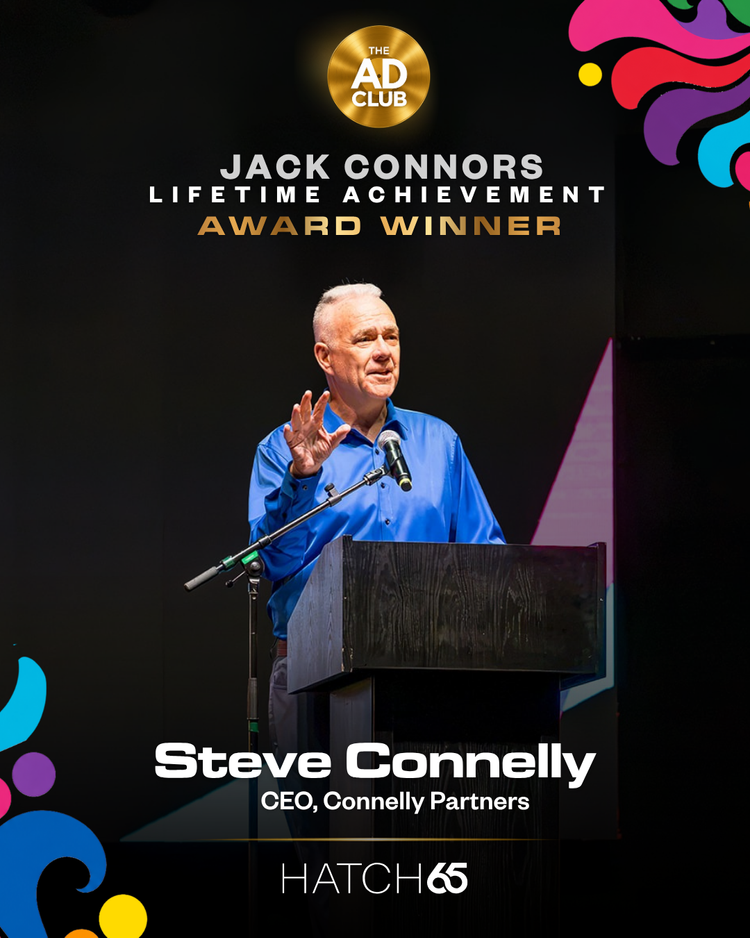
For The Ad Club’s 65th Annual Hatch Awards, I supported marketing and creative production from pre-show promotion through post-event engagement. My work included designing social content and marketing emails, creating digital and printed event materials, contributing to the awards presentation deck, and designing a full-page advertisement for The Boston Globe. I also assisted with run-of-show materials, event-day social coverage, and post-show community engagement.
Instagram views include feed posts, Reels, and event-day Stories. Growth compares dedicated Hatch Instagram feed posts and Reels in 2025 and 2026.
Social Content
Pre-Show Promotion
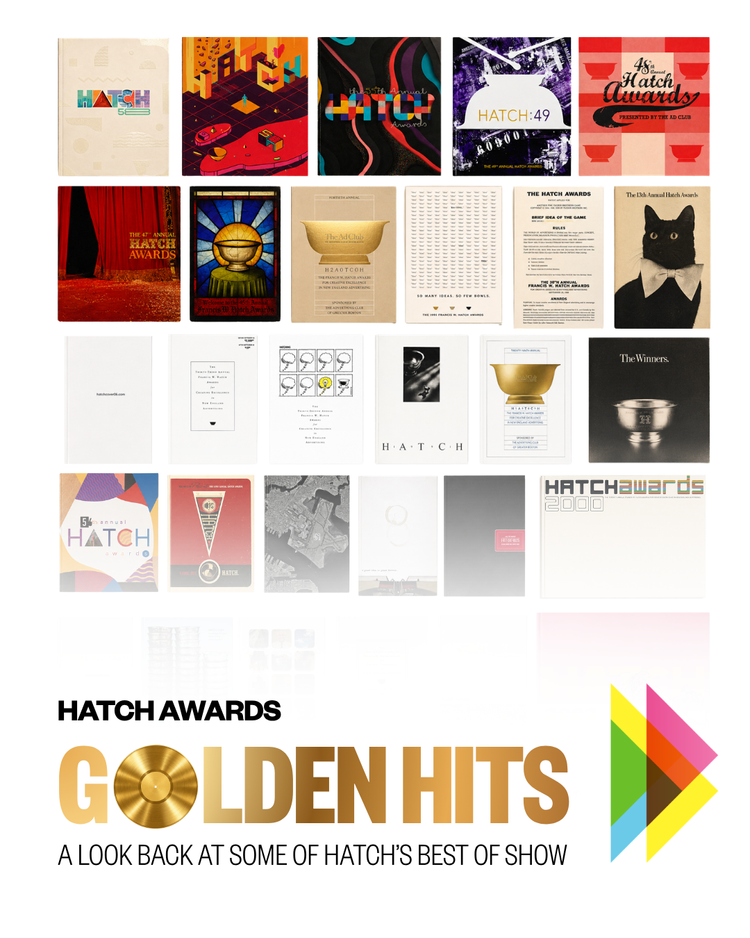
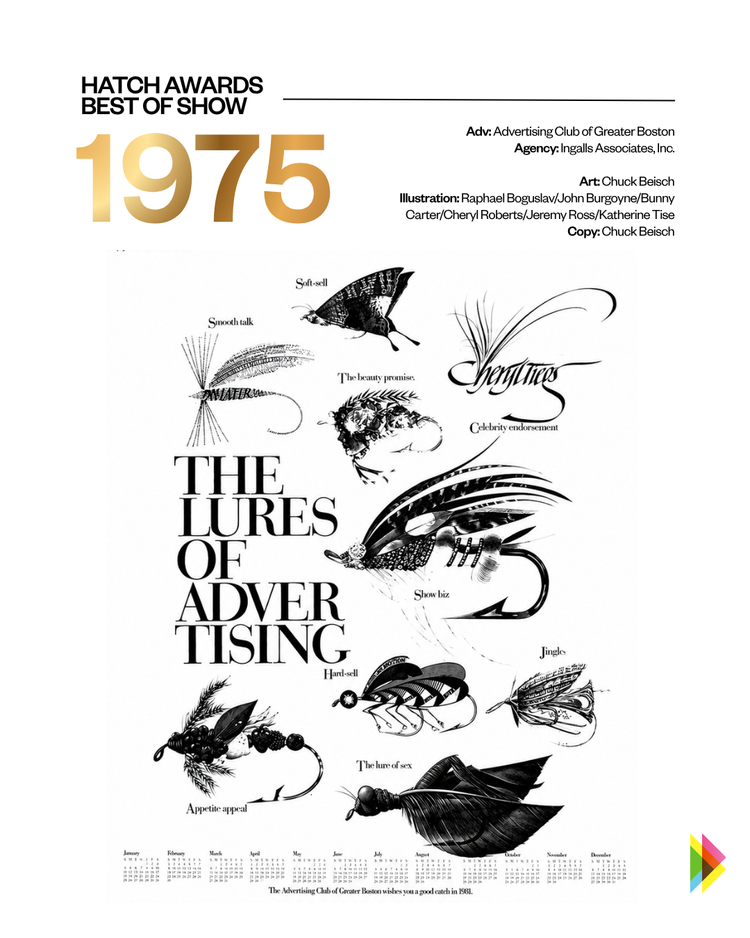
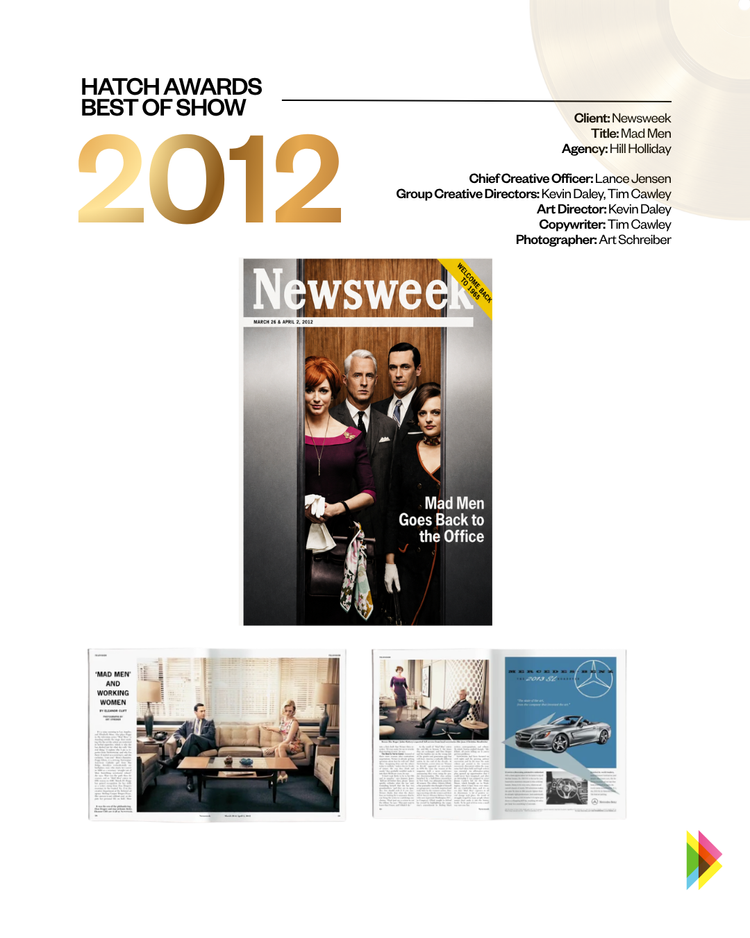
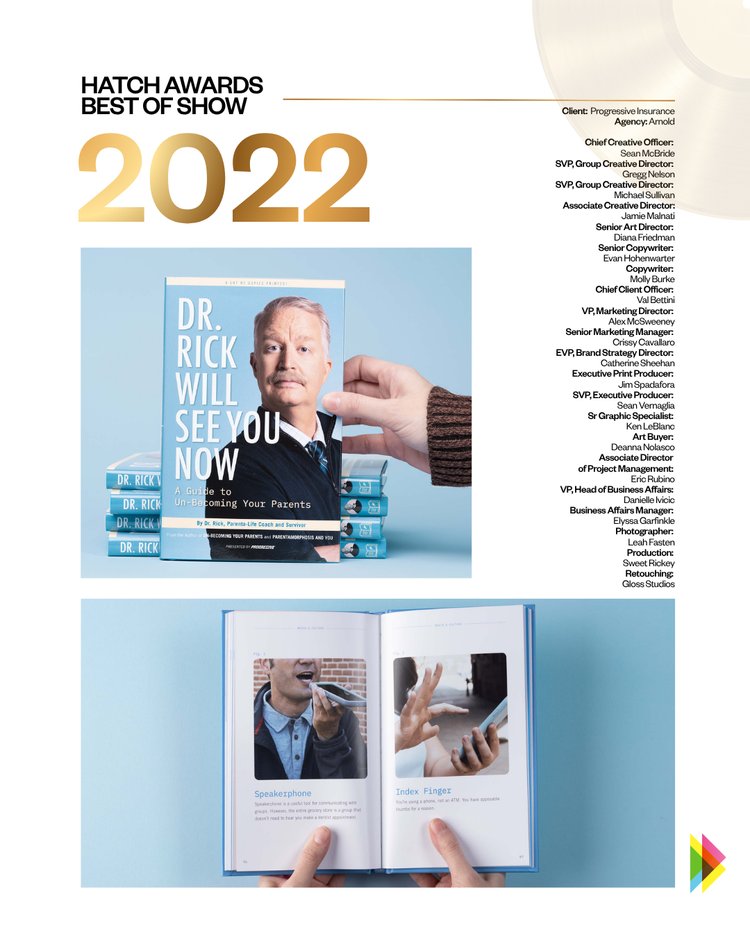
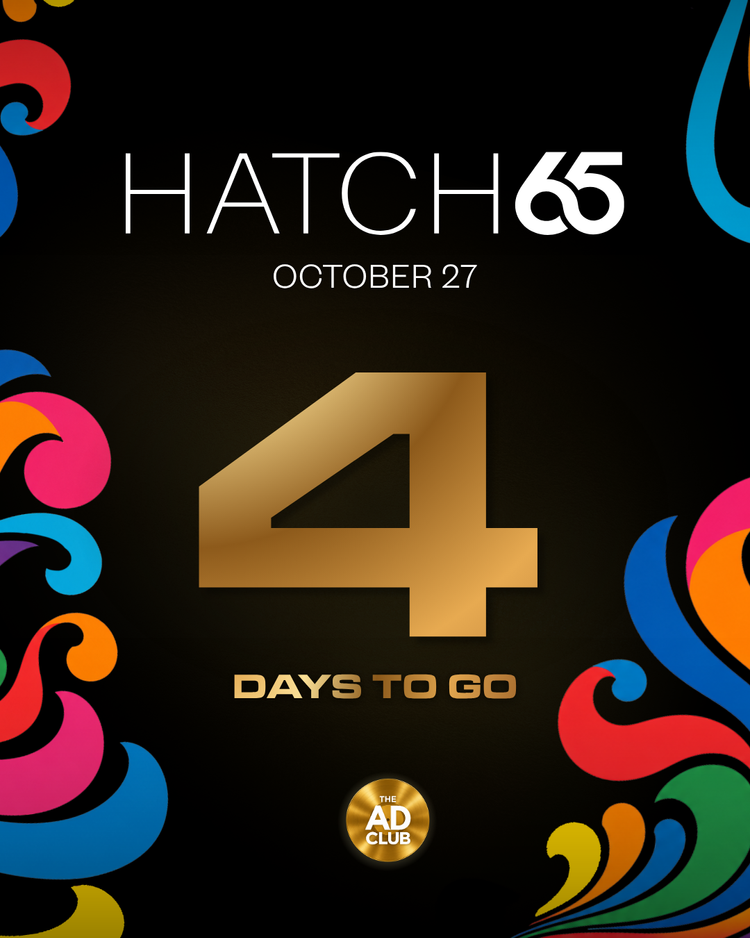
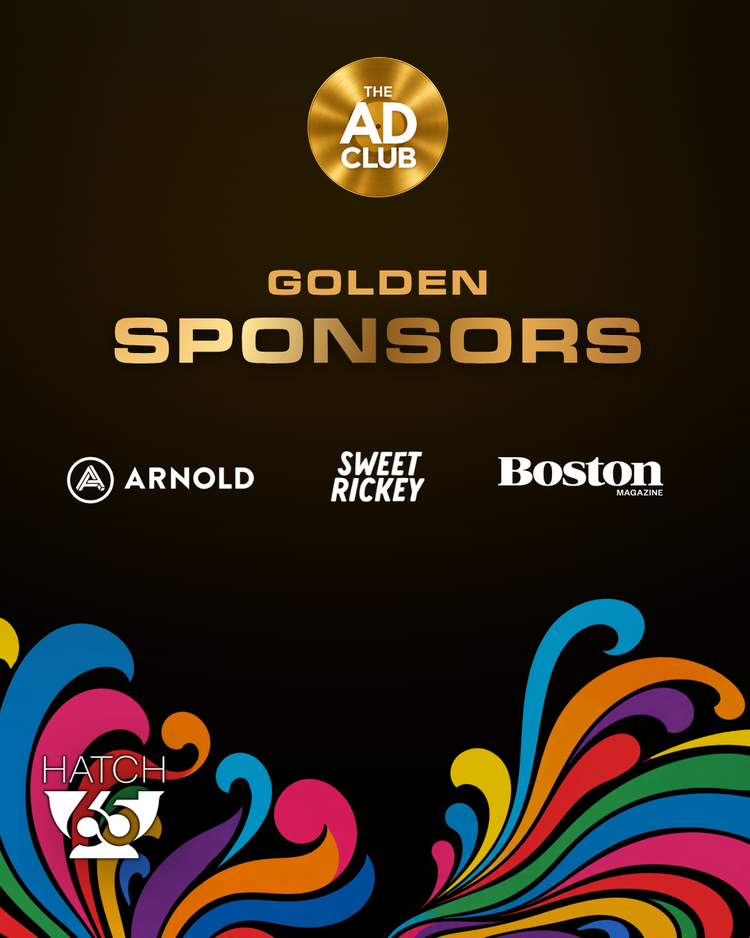
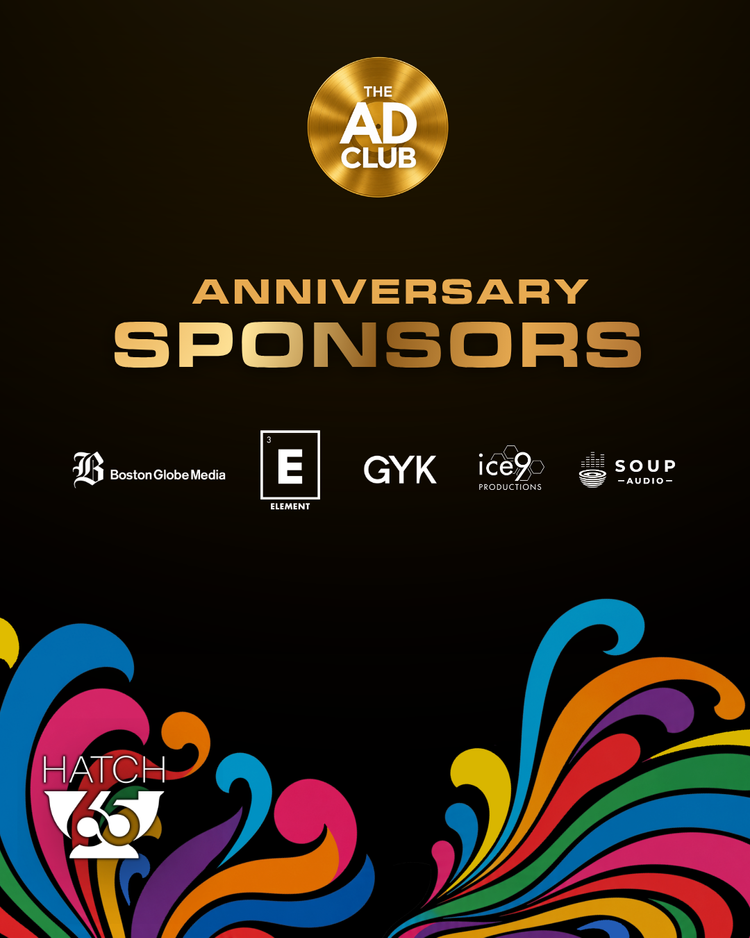
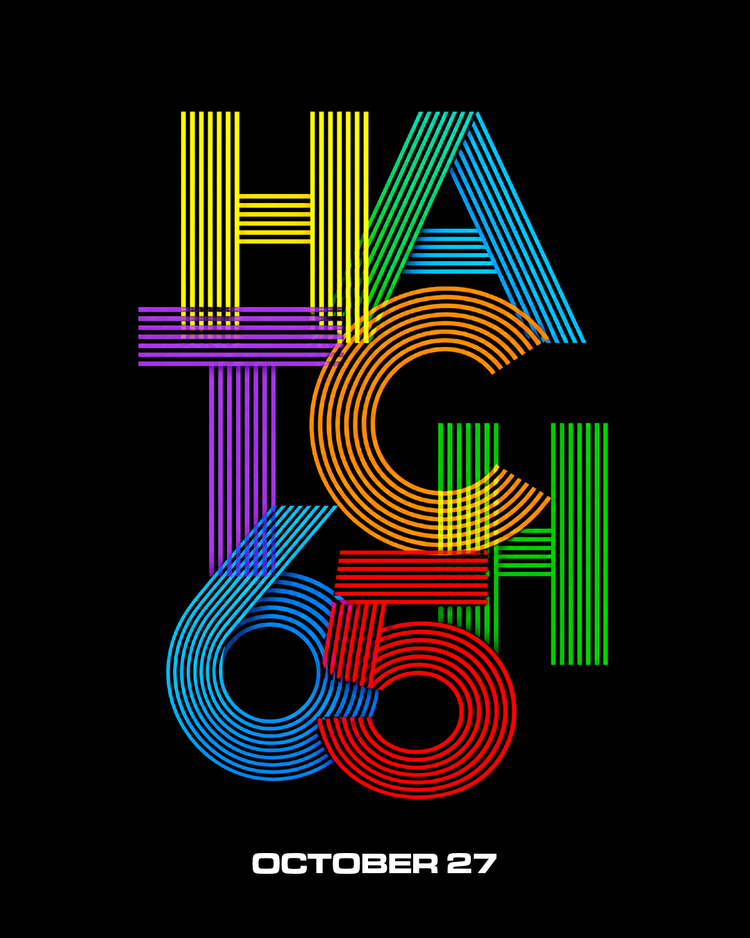
Post-Show Engagement
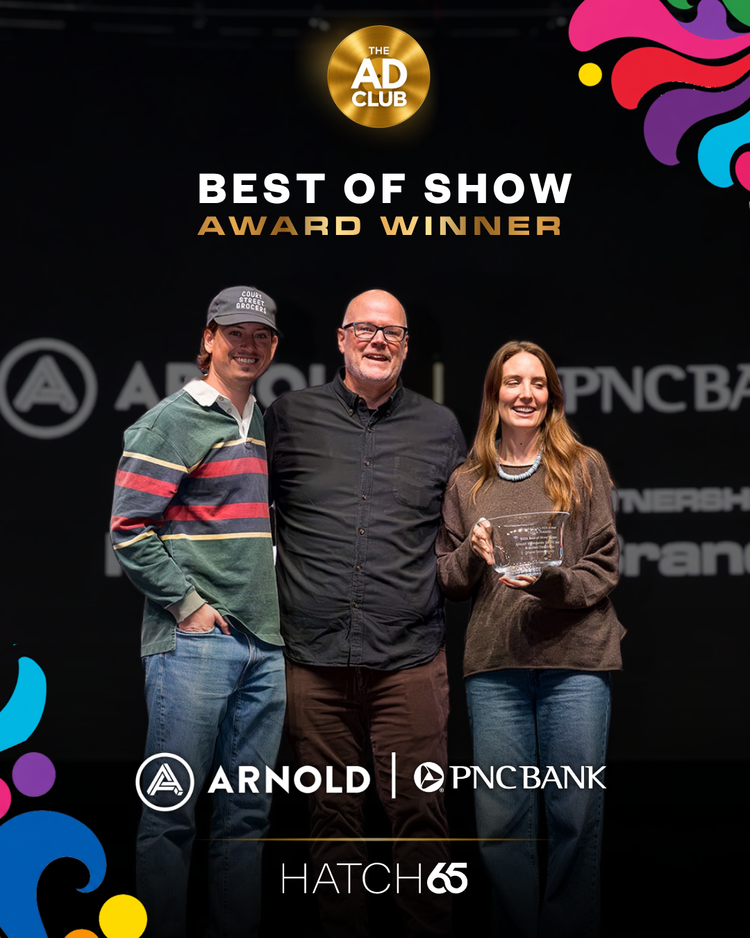
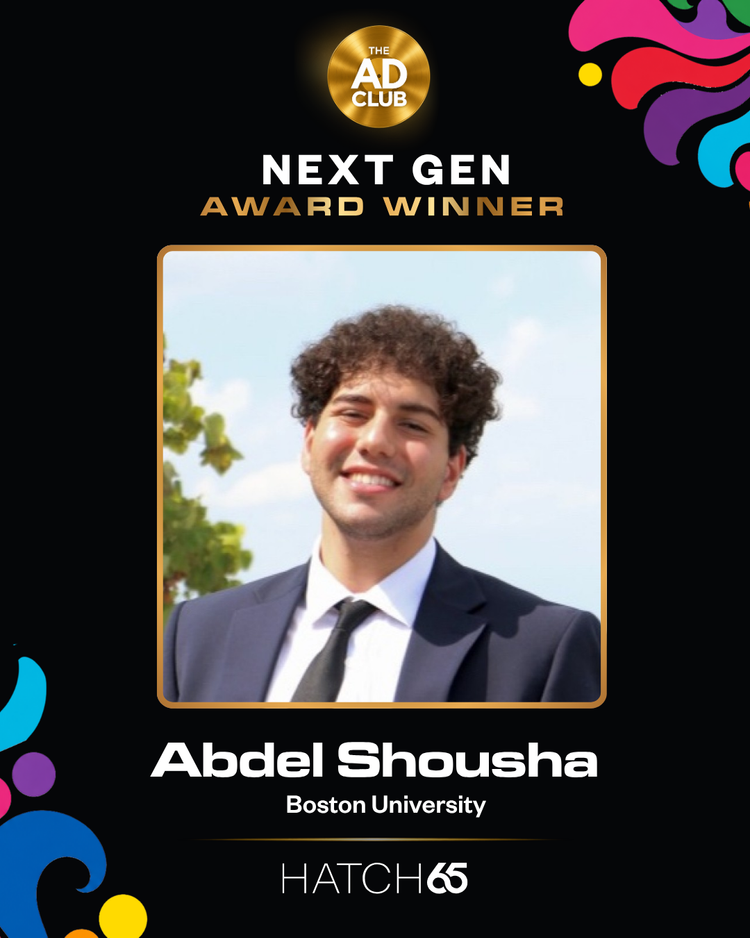
Email Marketing
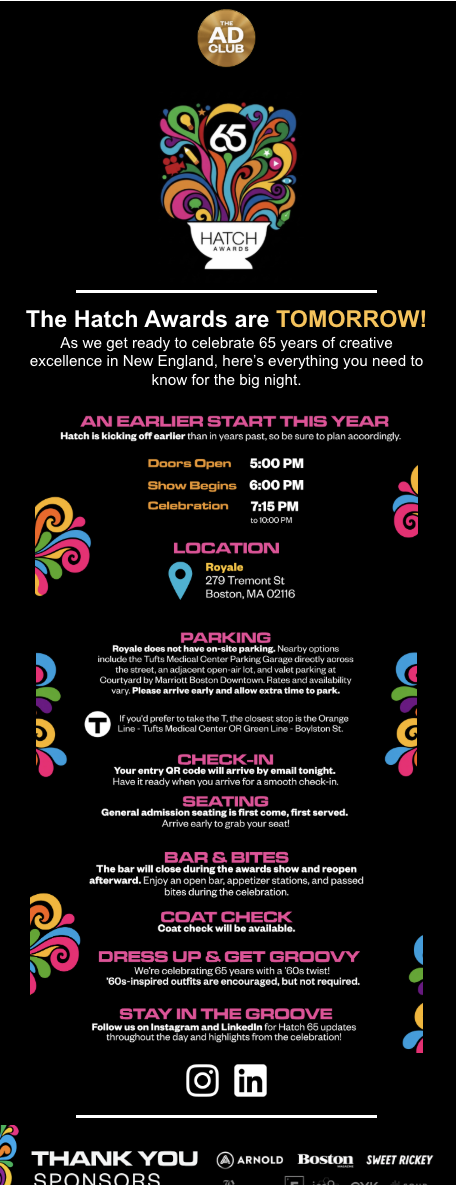
Selected promotional and follow-up emails designed for the 65th Annual Hatch Awards. Scroll within each preview to explore the email.
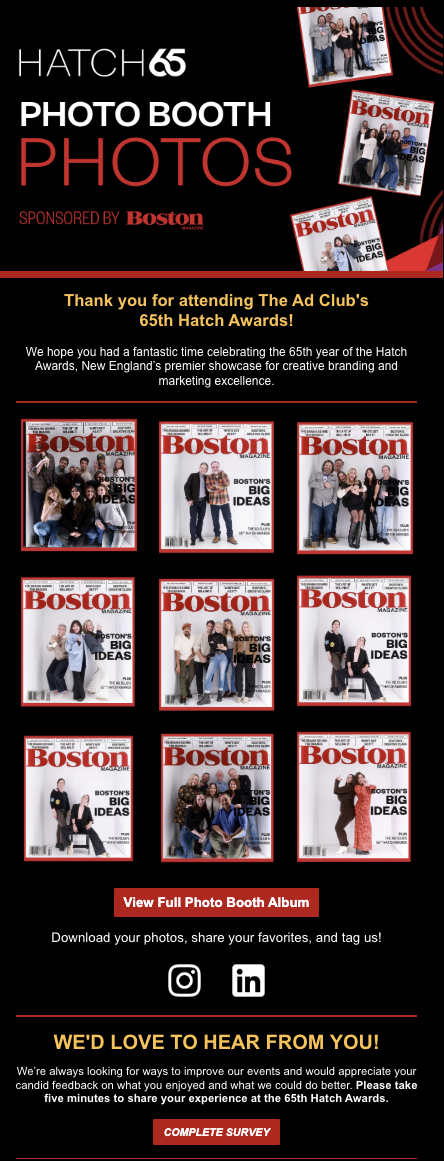
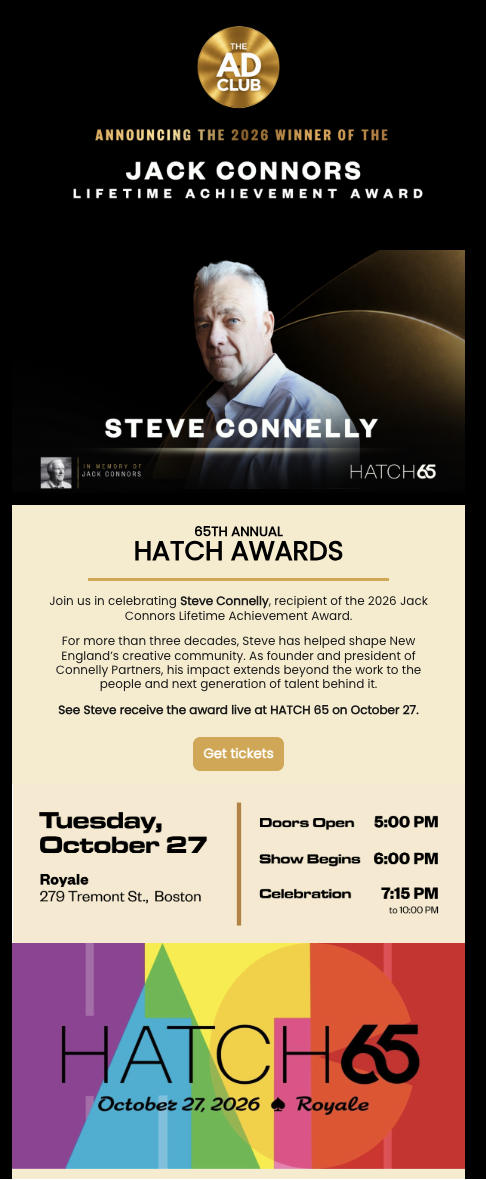
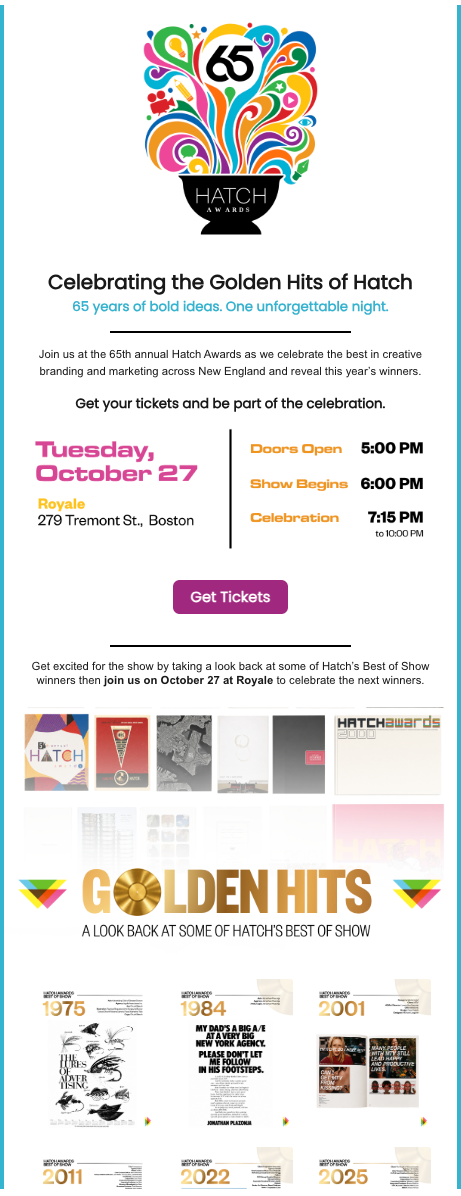
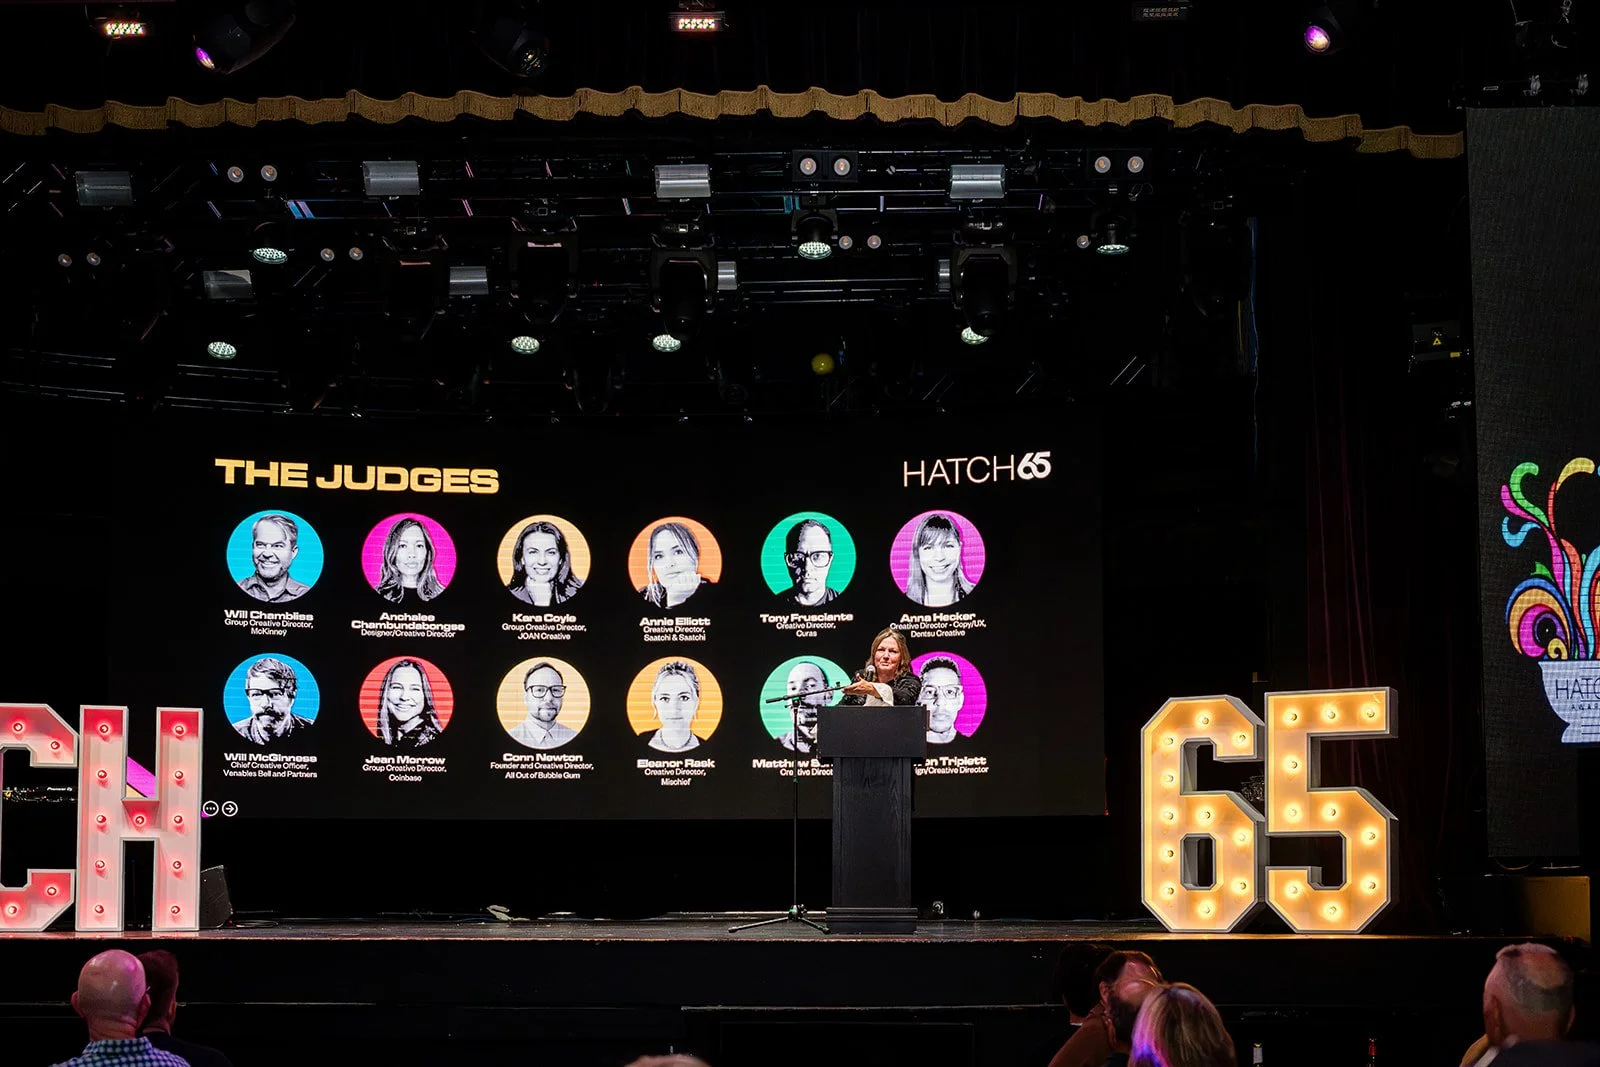
Awards Presentation Deck
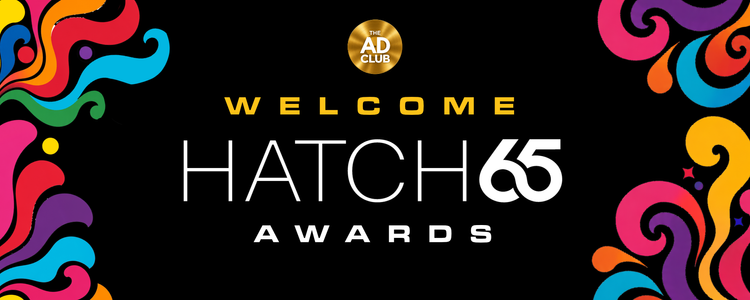
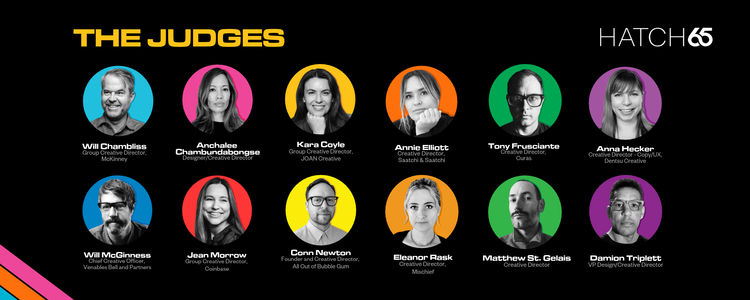
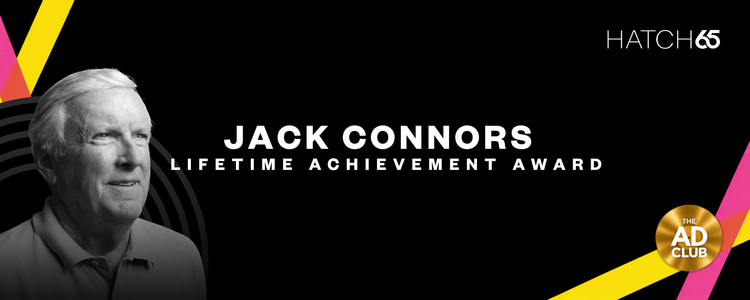
Selected slides from the 65th Annual Hatch Awards presentation.
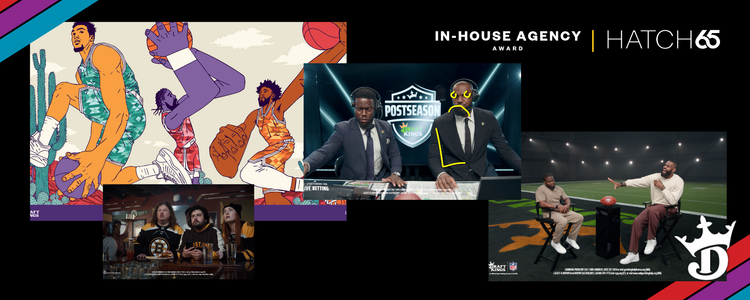
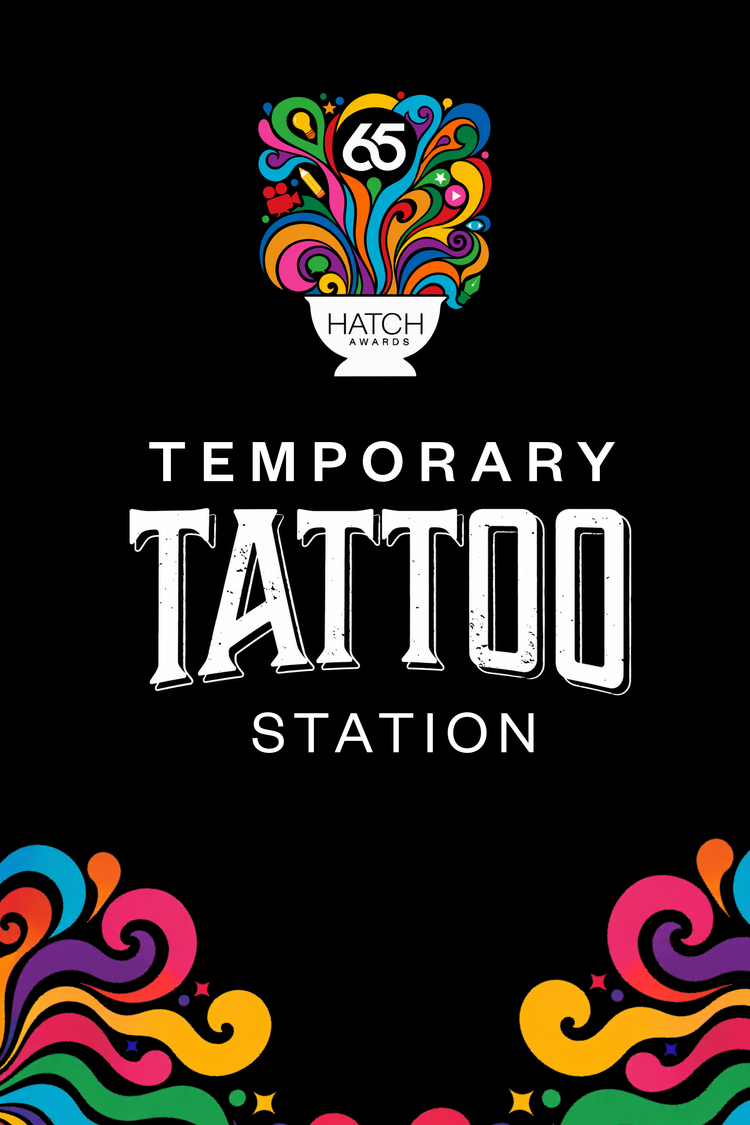
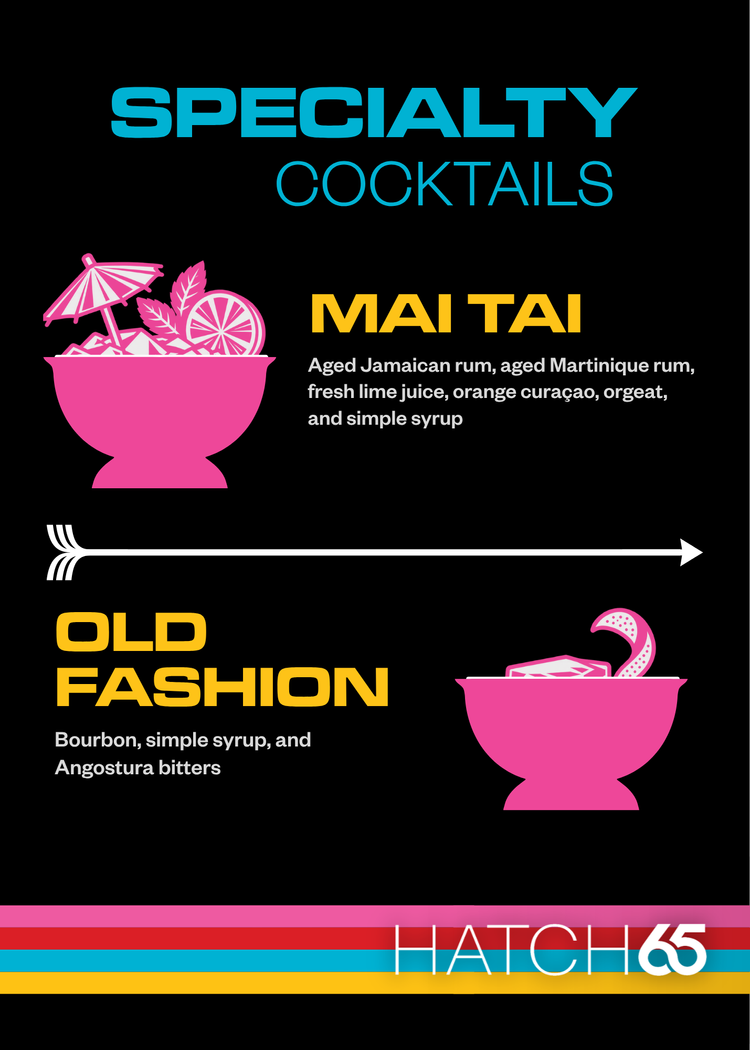
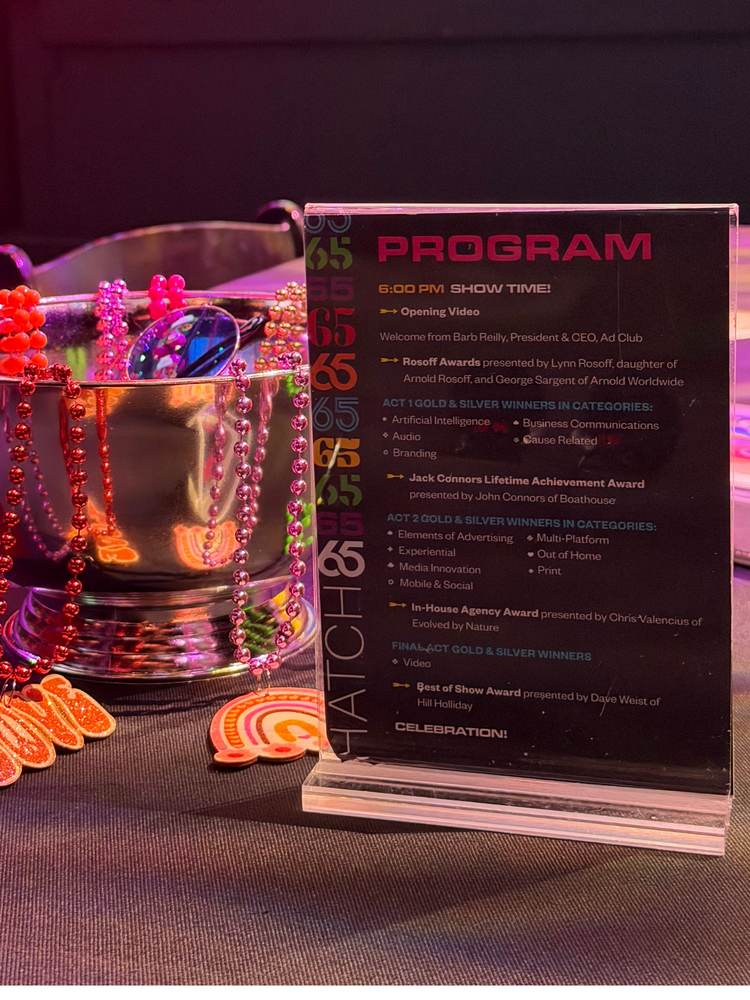
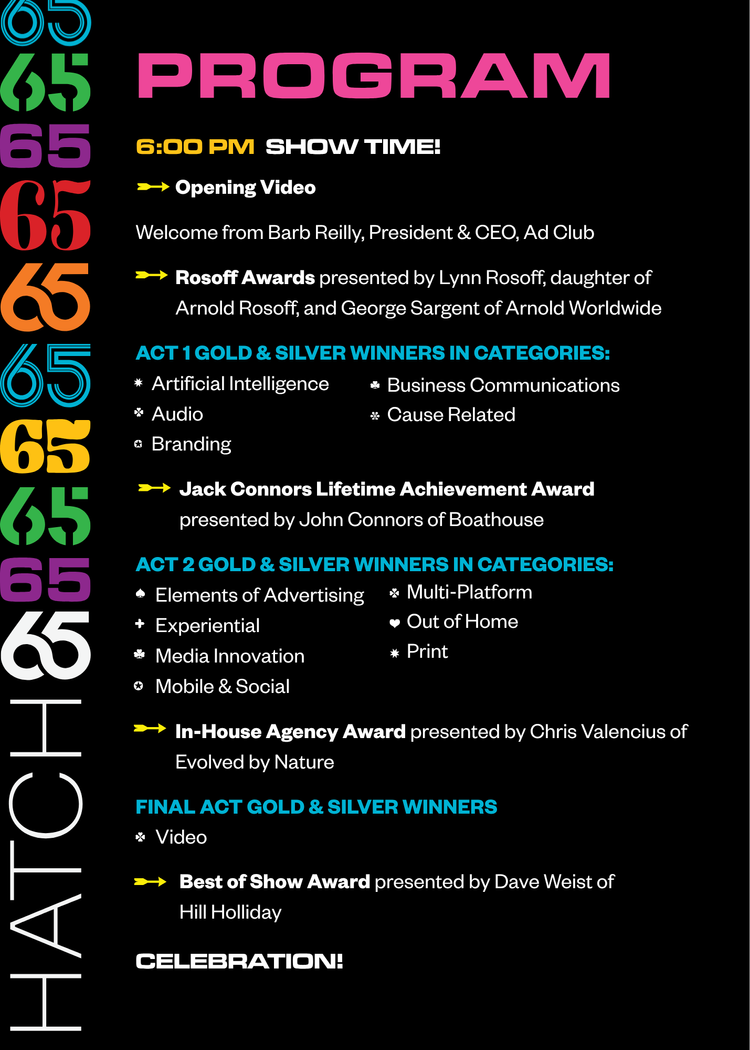
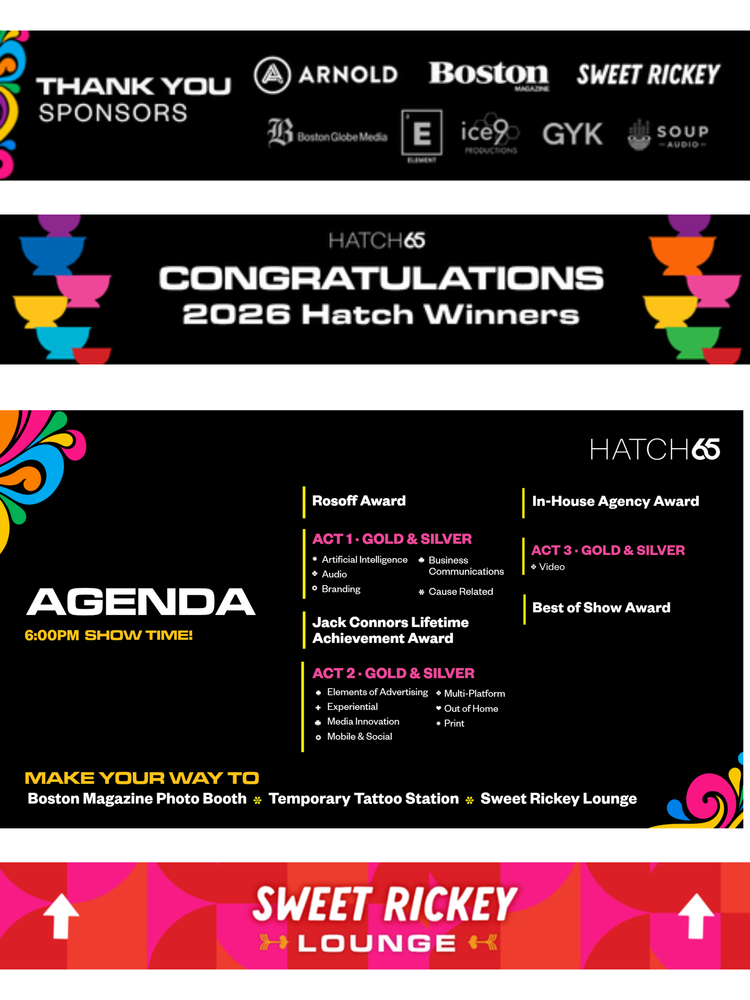
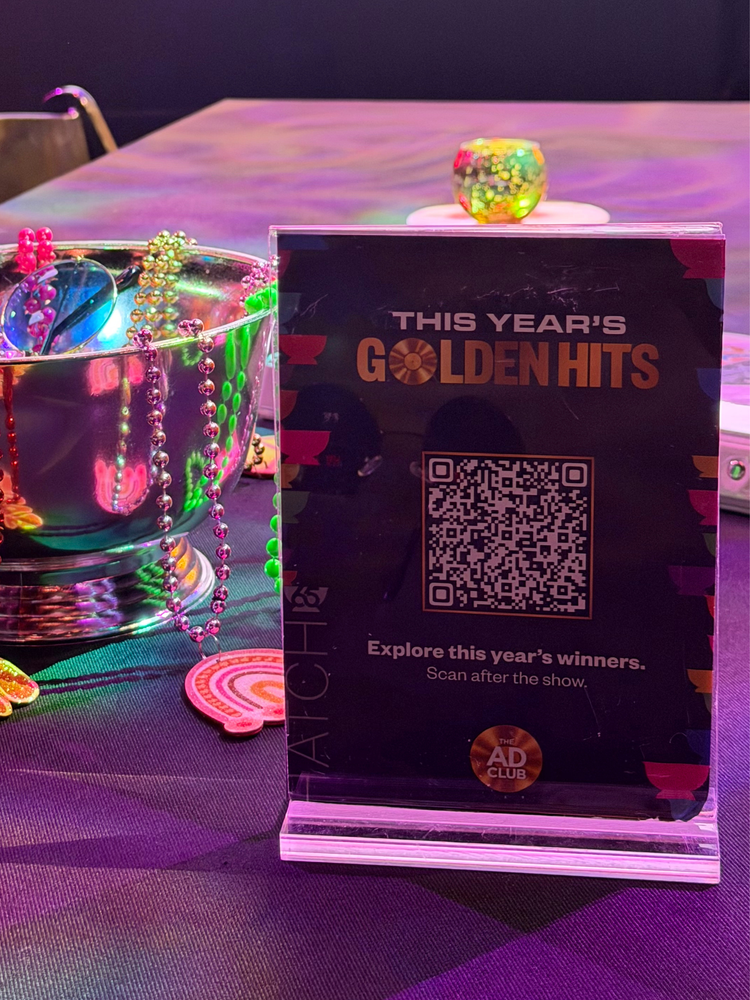
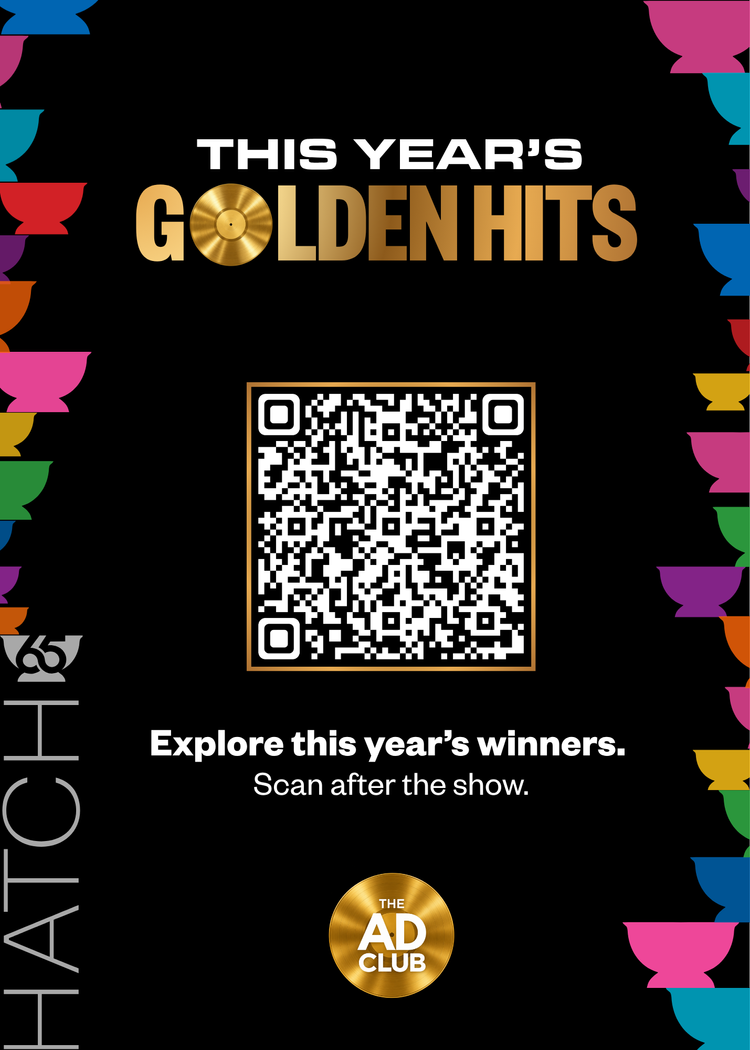
Digital & Printed Event Materials
Hover over or tap the photos to view the designs. Keyboard users can focus each photo.
Campaign Results
Explore platform results and year-over-year comparisons. All results are as of November 13, 2026, while the campaign remains ongoing.
Instagram Performance · 2025 vs. 2026
| Metric | 2025 | 2026 | Change |
|---|---|---|---|
| Feed posts and Reels | 12 | 16 | +33.3% |
| Views | 10,939 | 21,631 | +97.7% |
| Likes | 99 | 651 | +557.6% |
| Comments | 2 | 28 | +1,300.0% |
| Shares | 23 | 91 | +295.7% |
| Saves | 2 | 22 | +1,000.0% |
| Total interactions | 126 | 792 | +528.6% |
| Average views per post | 911.6 | 1,351.9 | +48.3% |
| Average interactions per post | 10.5 | 49.5 | +371.4% |
Feed interactions include likes, comments, shares, and saves. Average views per post increased 48.3%, alongside the increase in posting volume.
| Metric | Oct. 23, 2025 | Oct. 27, 2026 | Change |
|---|---|---|---|
| Stories posted | 8 | 18 | +125.0% |
| Views | 2,602 | 9,175 | +252.6% |
| Combined Story reach | 1,785 | 5,927 | +232.0% |
| Average views per Story | 325.3 | 509.7 | +56.7% |
| Likes | 16 | 40 | +150.0% |
| Shares | 1 | 10 | +900.0% |
| Replies | 3 | 2 | −33.3% |
| Sticker taps | 28 | 68 | +142.9% |
This comparison includes only Stories published on each event date. Combined reach is summed across Stories and may count the same person multiple times.
LinkedIn Performance · 2026
| Metric | Total |
|---|---|
| Hatch-related posts | 25 |
| Impressions | 18,358 |
| Clicks | 2,610 |
| Reactions | 676 |
| Comments | 116 |
| Reposts | 21 |
| Total engagements | 3,423 |
LinkedIn engagements include clicks, reactions, comments, and reposts.
Email Performance · 2024–2026
These results cover promotional emails, call-for-entries emails, and award announcements. They exclude attendee logistics, personal invitations, and post-event emails. Total sends include repeat recipients across campaigns. Rates use delivered emails, calculated as sends minus bounces.
| Metric | 2024 | 2025 | 2026 |
|---|---|---|---|
| Promotional emails | 16 | 14 | 21 |
| Total sends | 102,781 | 54,659 | 136,954 |
| Recorded opens | 30,520 | 20,058 | 45,087 |
| Open rate | 31.64% | 38.15% | 34.25% |
| Recorded clicks | 2,707 | 627 | 1,597 |
| Click rate | 2.81% | 1.19% | 1.21% |
| Unsubscribes | 37 | 24 | 91 |
| Unsubscribe rate | 0.038% | 0.046% | 0.069% |
Compared with 2025, promotional sends increased approximately 151%. The open rate decreased 3.90 percentage points, while the click rate increased 0.02 percentage points.
| Metric | 2024 | 2025 | 2026 |
|---|---|---|---|
| Campaigns | 3 | 3 | 5 |
| Total sends | 11,694 | 13,844 | 26,477 |
| Open rate | 34.86% | 35.21% | 25.40% |
| Recorded clicks | 188 | 168 | 184 |
| Click rate | 1.66% | 1.26% | 0.72% |
October ticket promotions provide a closer comparison of final ticket-promotion emails. Compared with 2025, 2026 sends increased approximately 91%, while recorded clicks increased approximately 10%. Open and click rates declined.
Print Advertising
Full-page ad for upcoming publication in

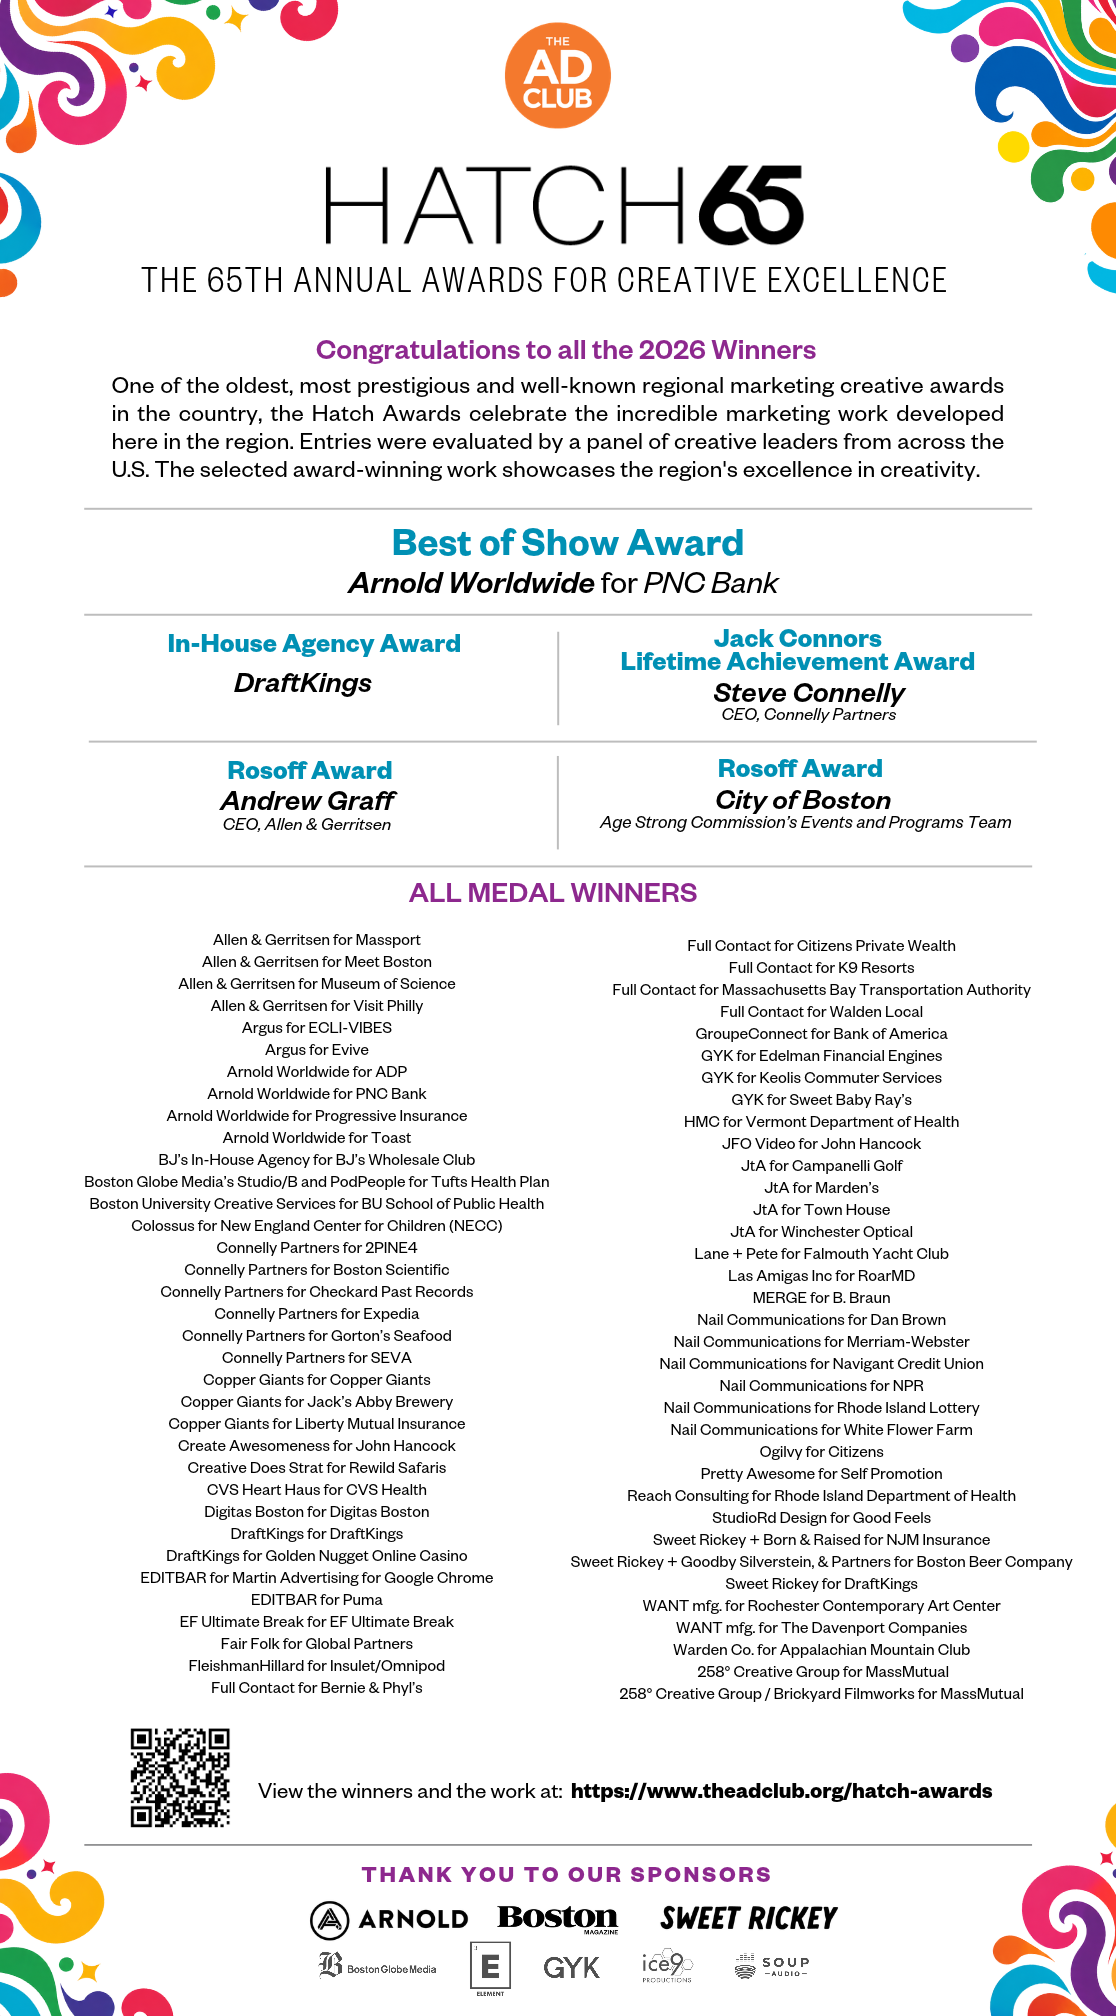
Click the ad to view full size ↗
Reels
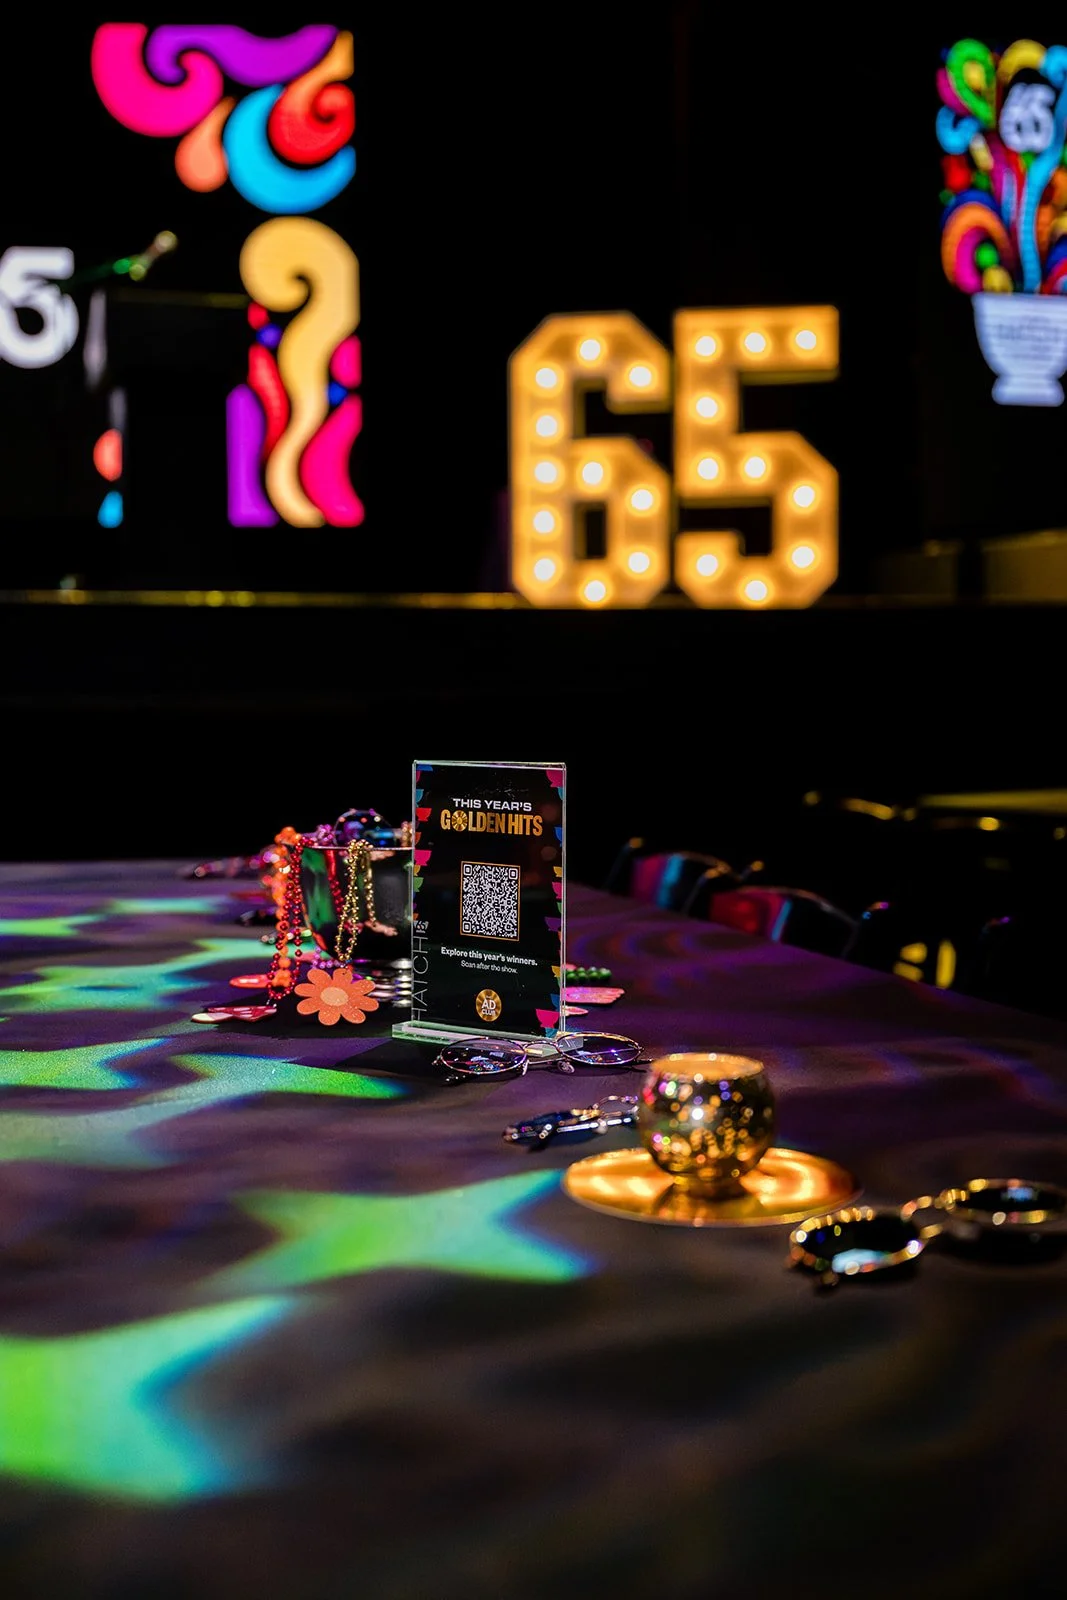
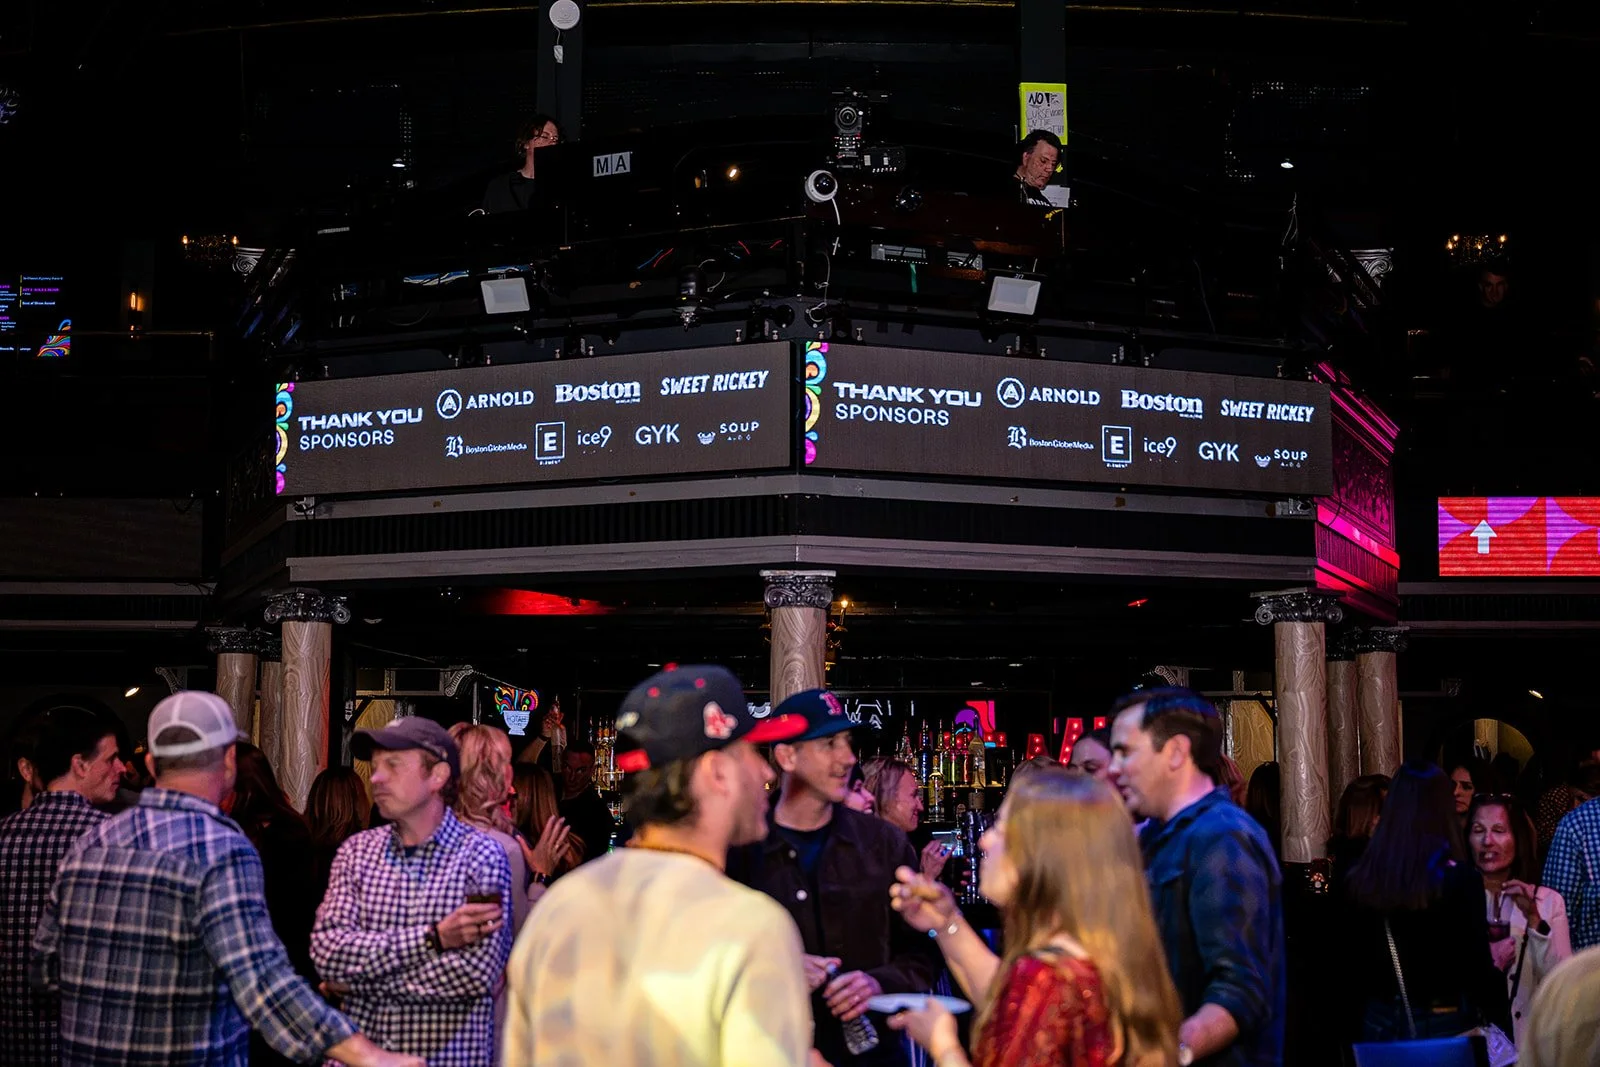
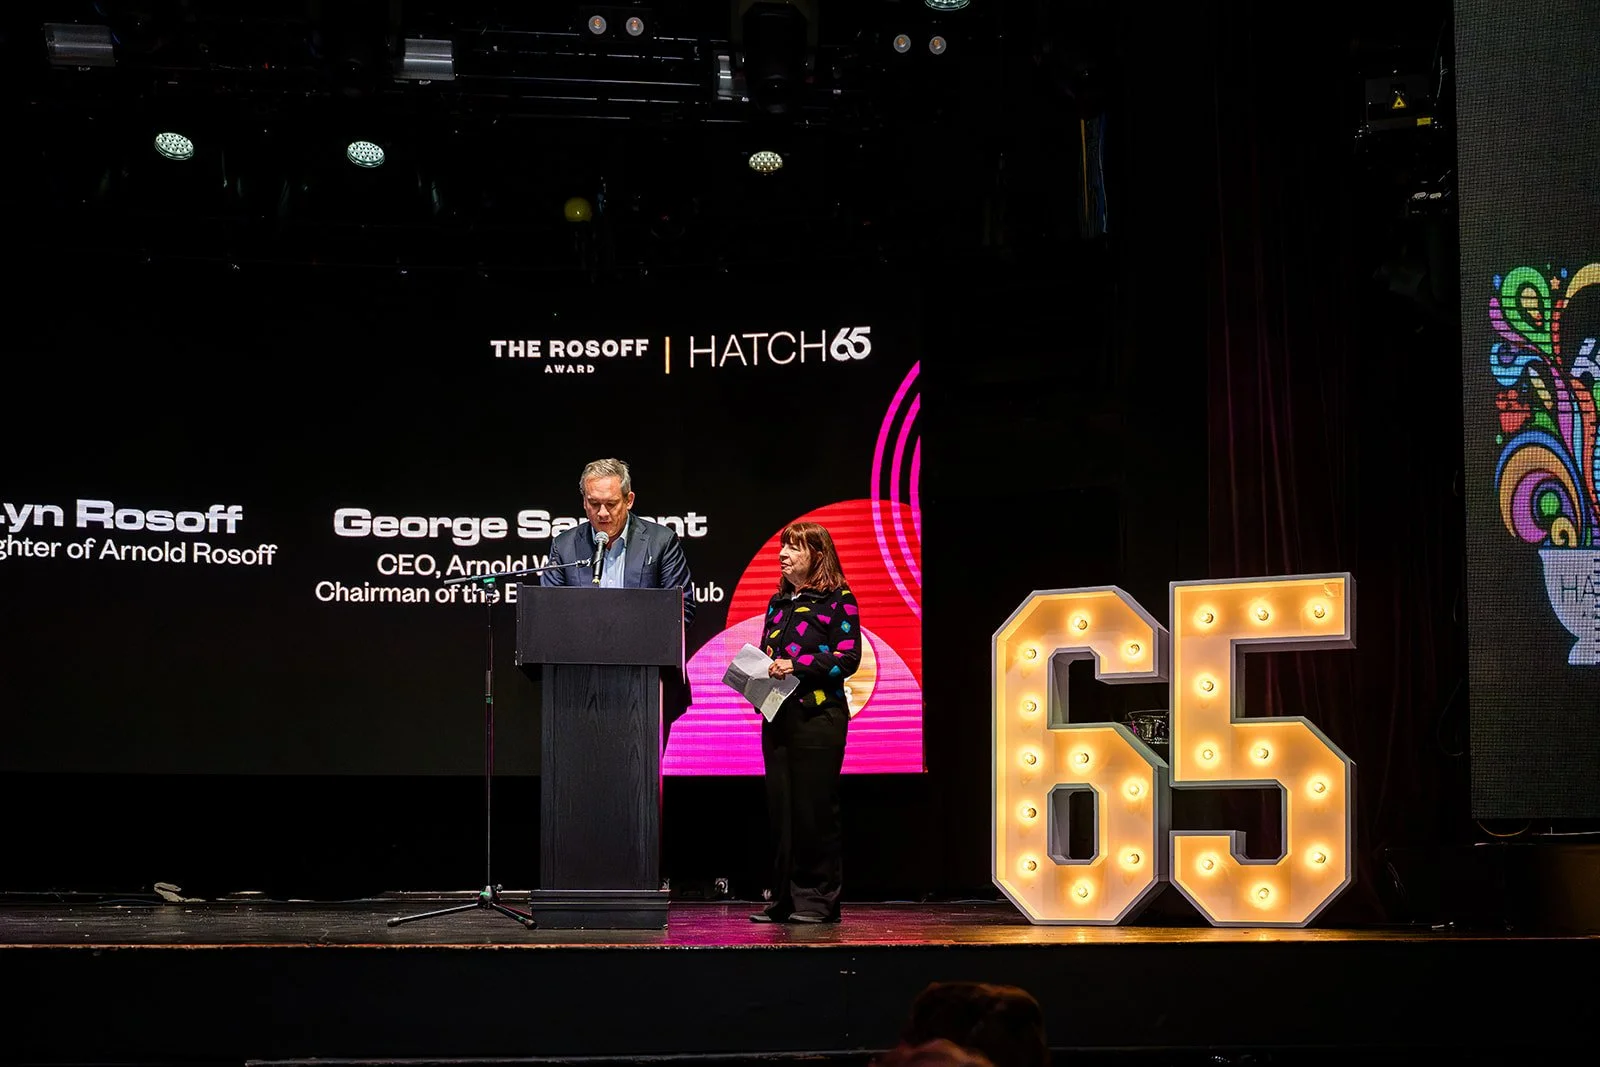
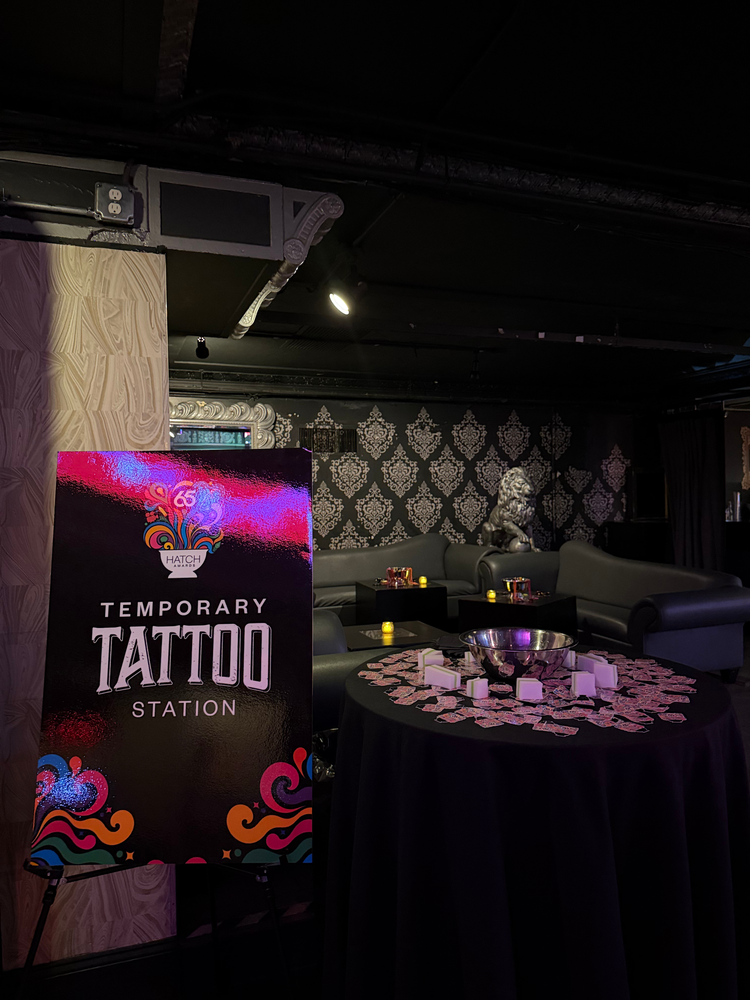
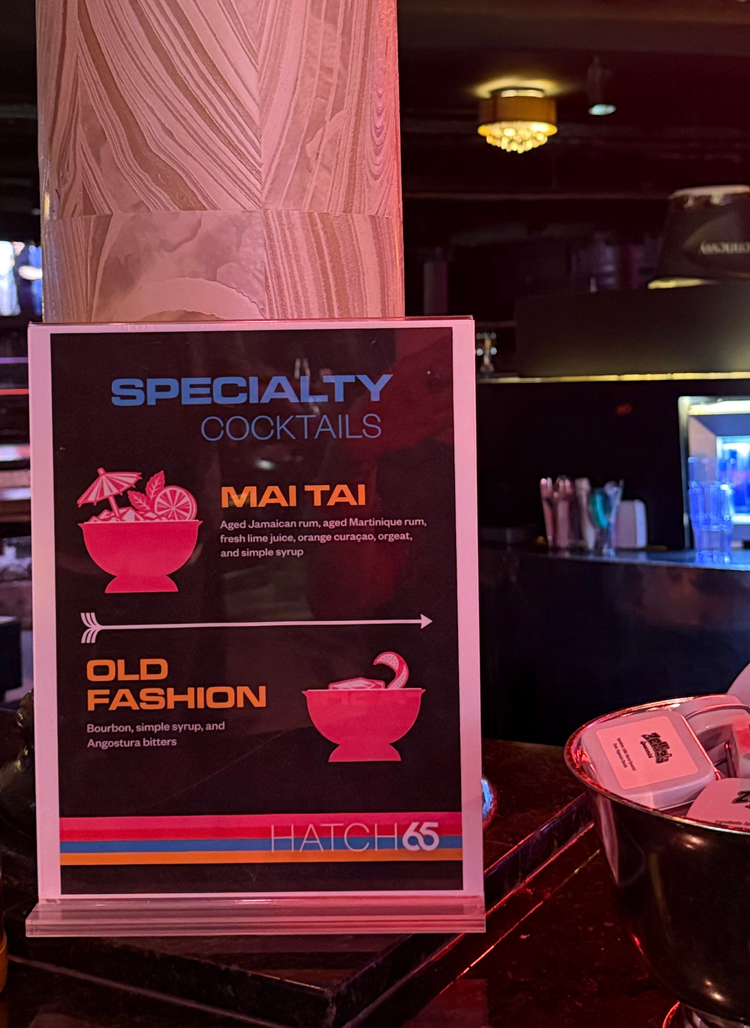
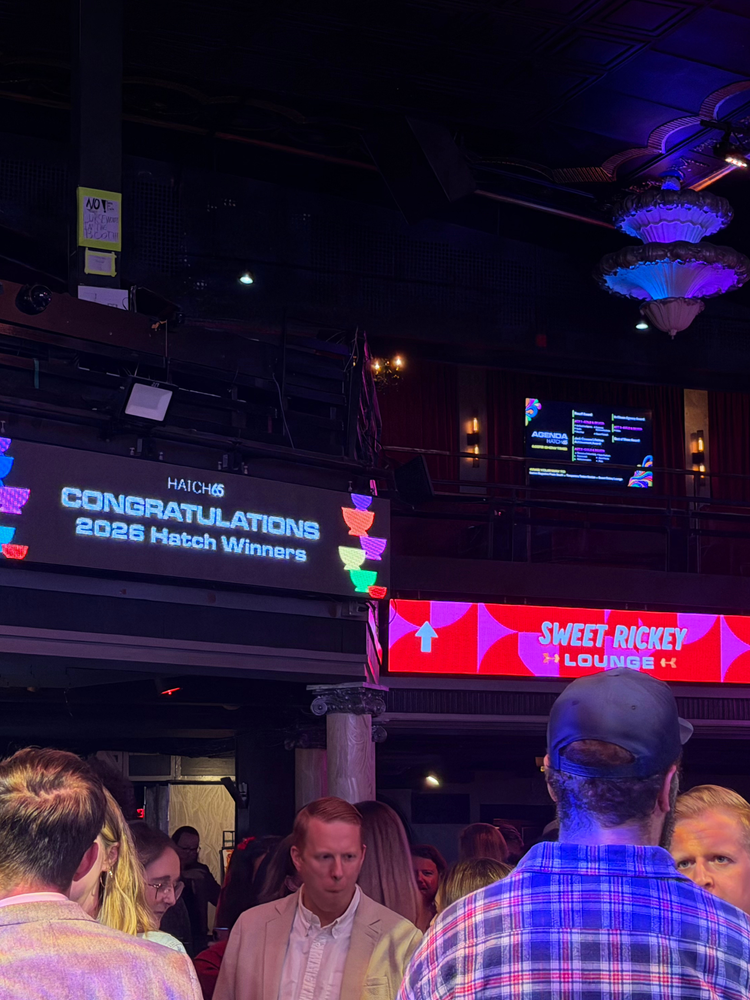
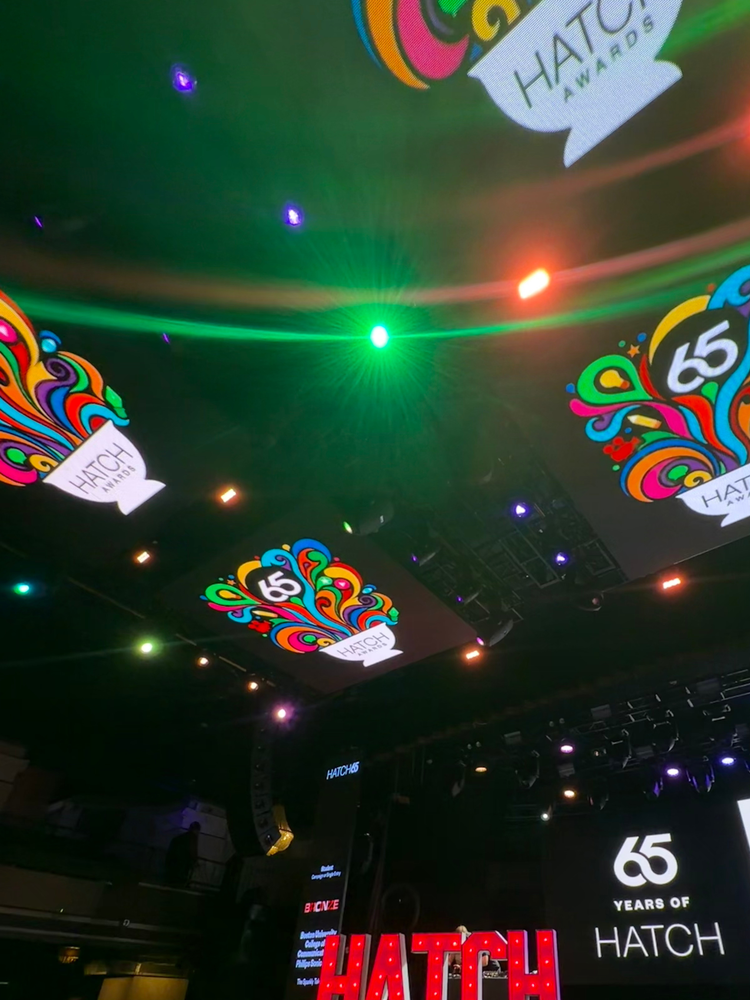
Event Photos
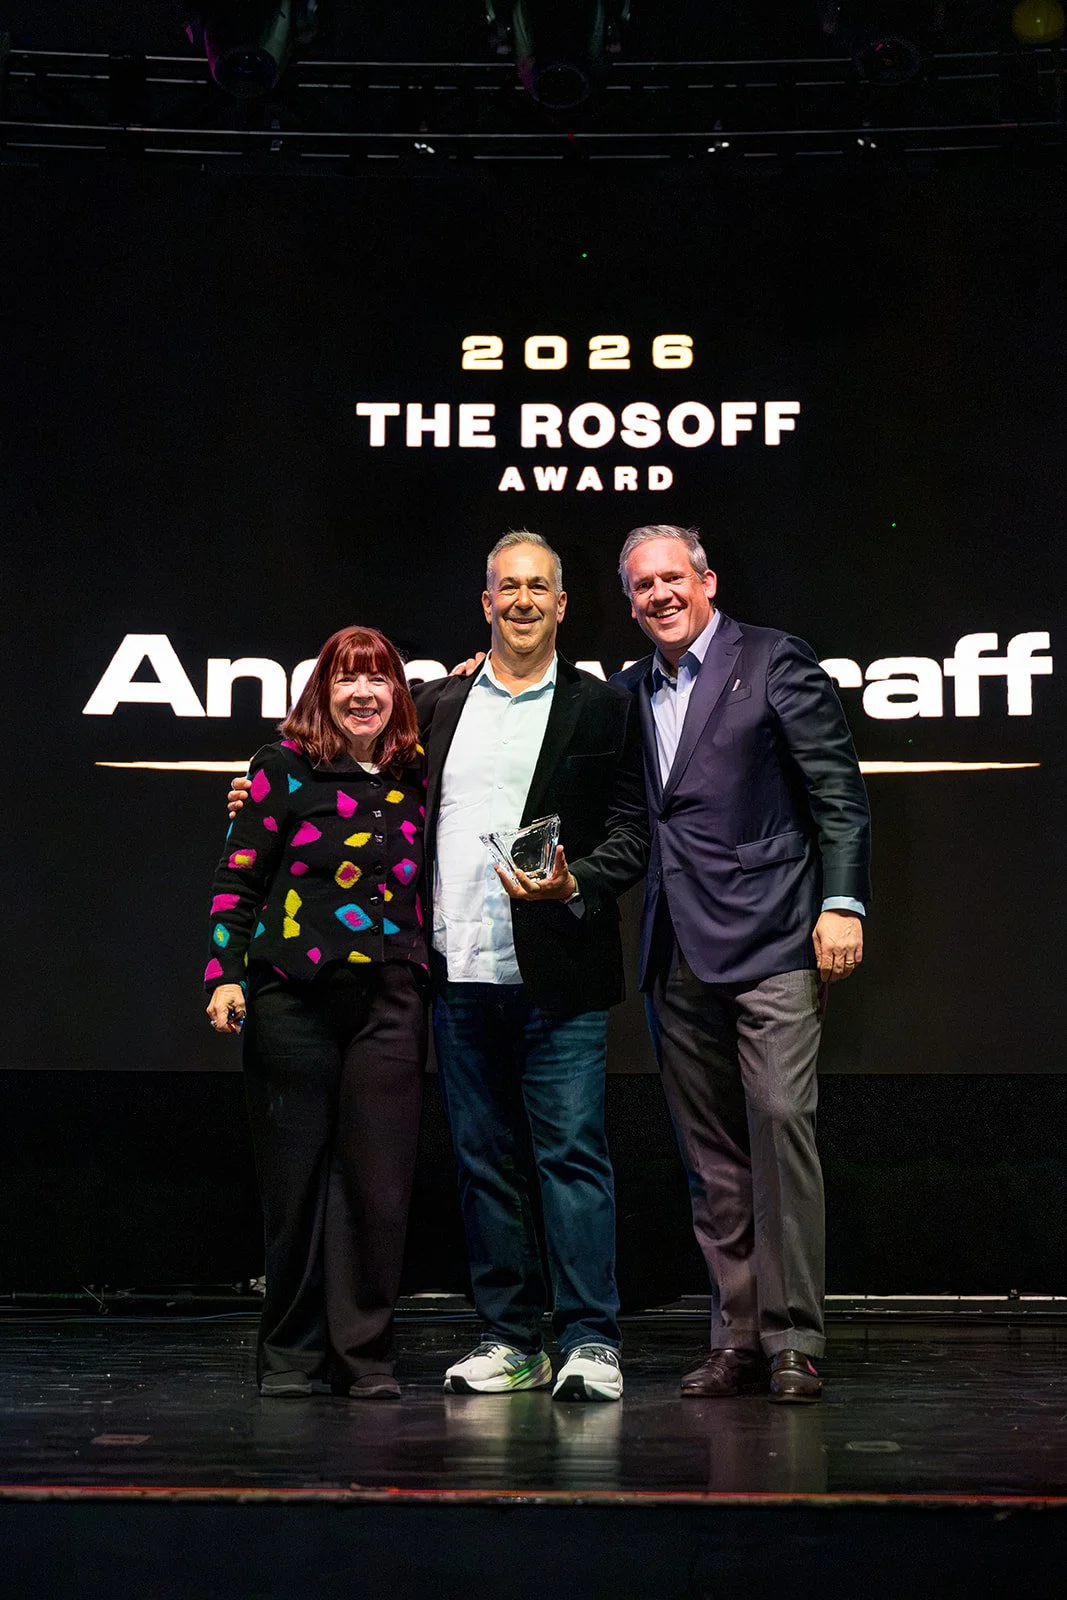
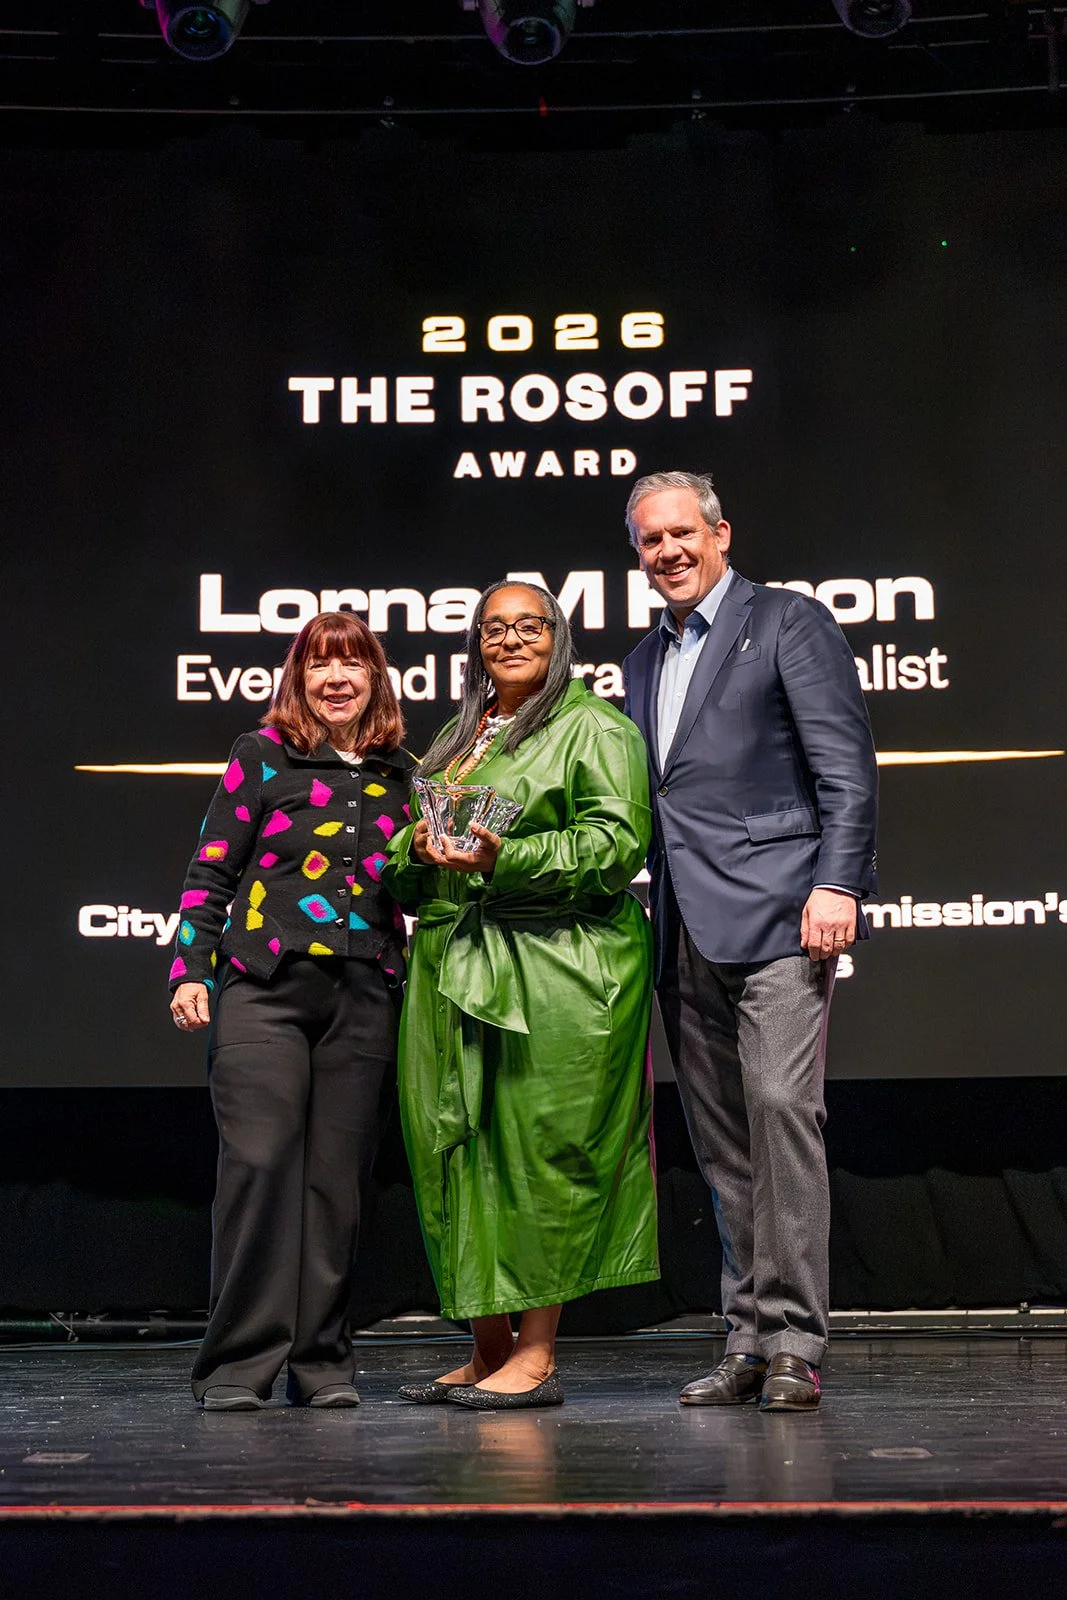
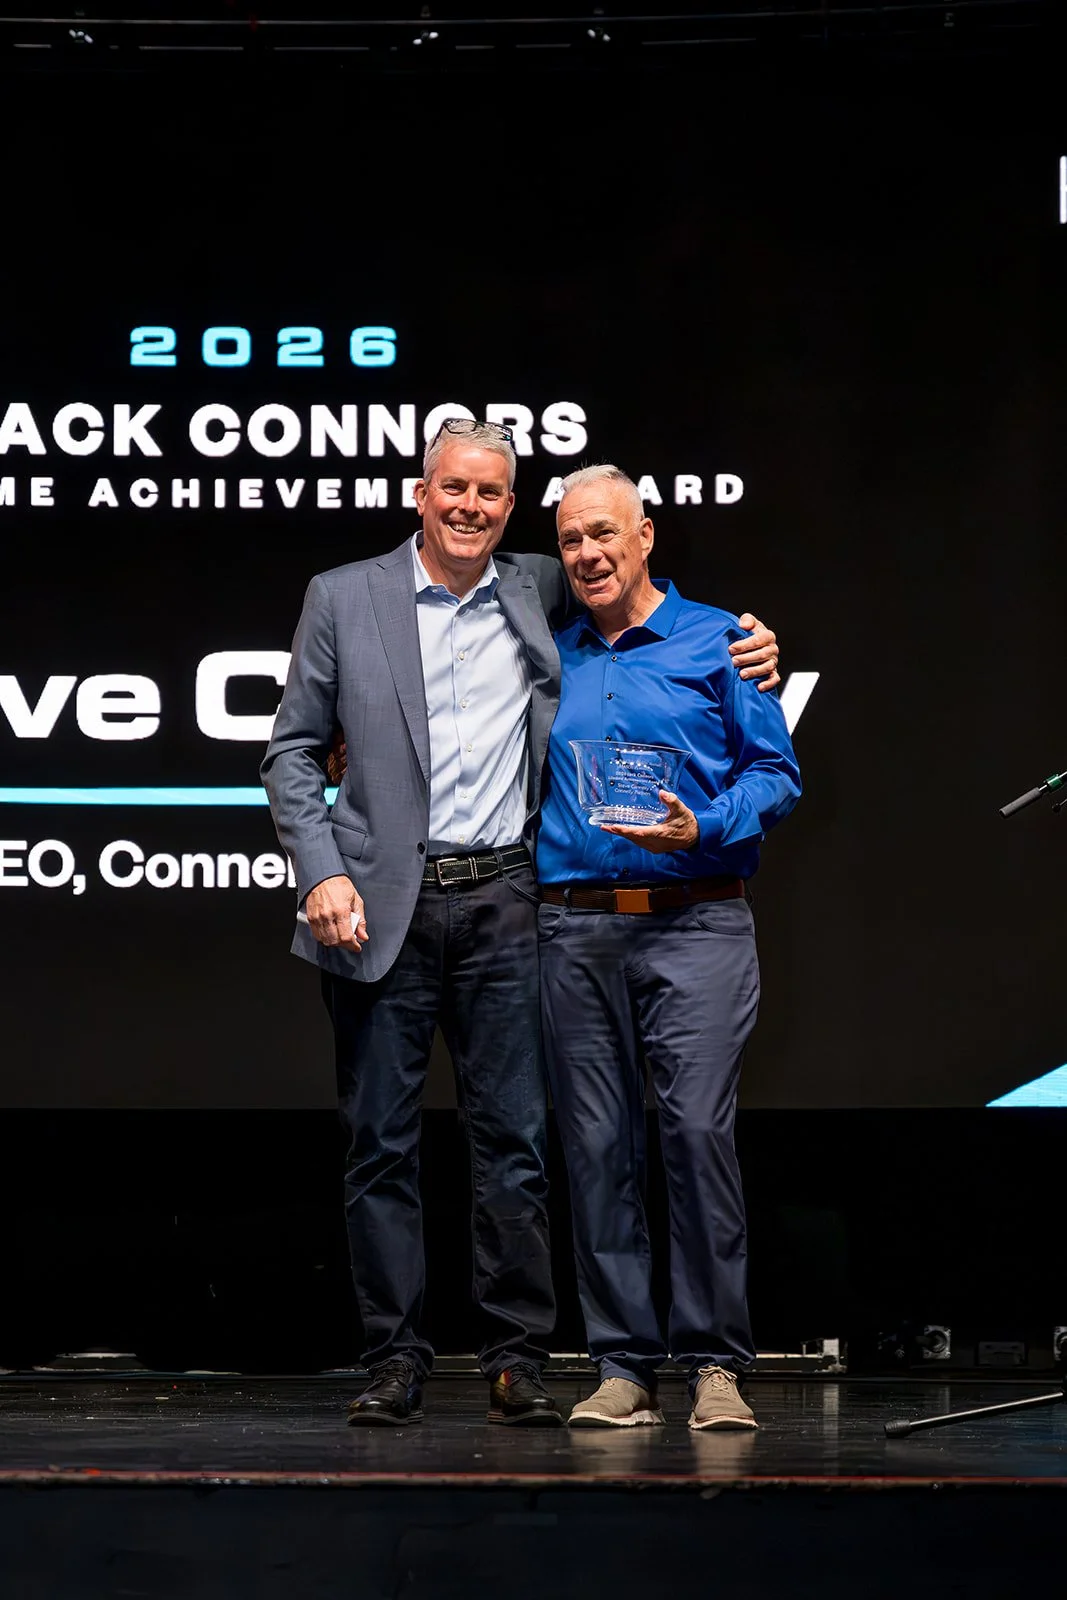
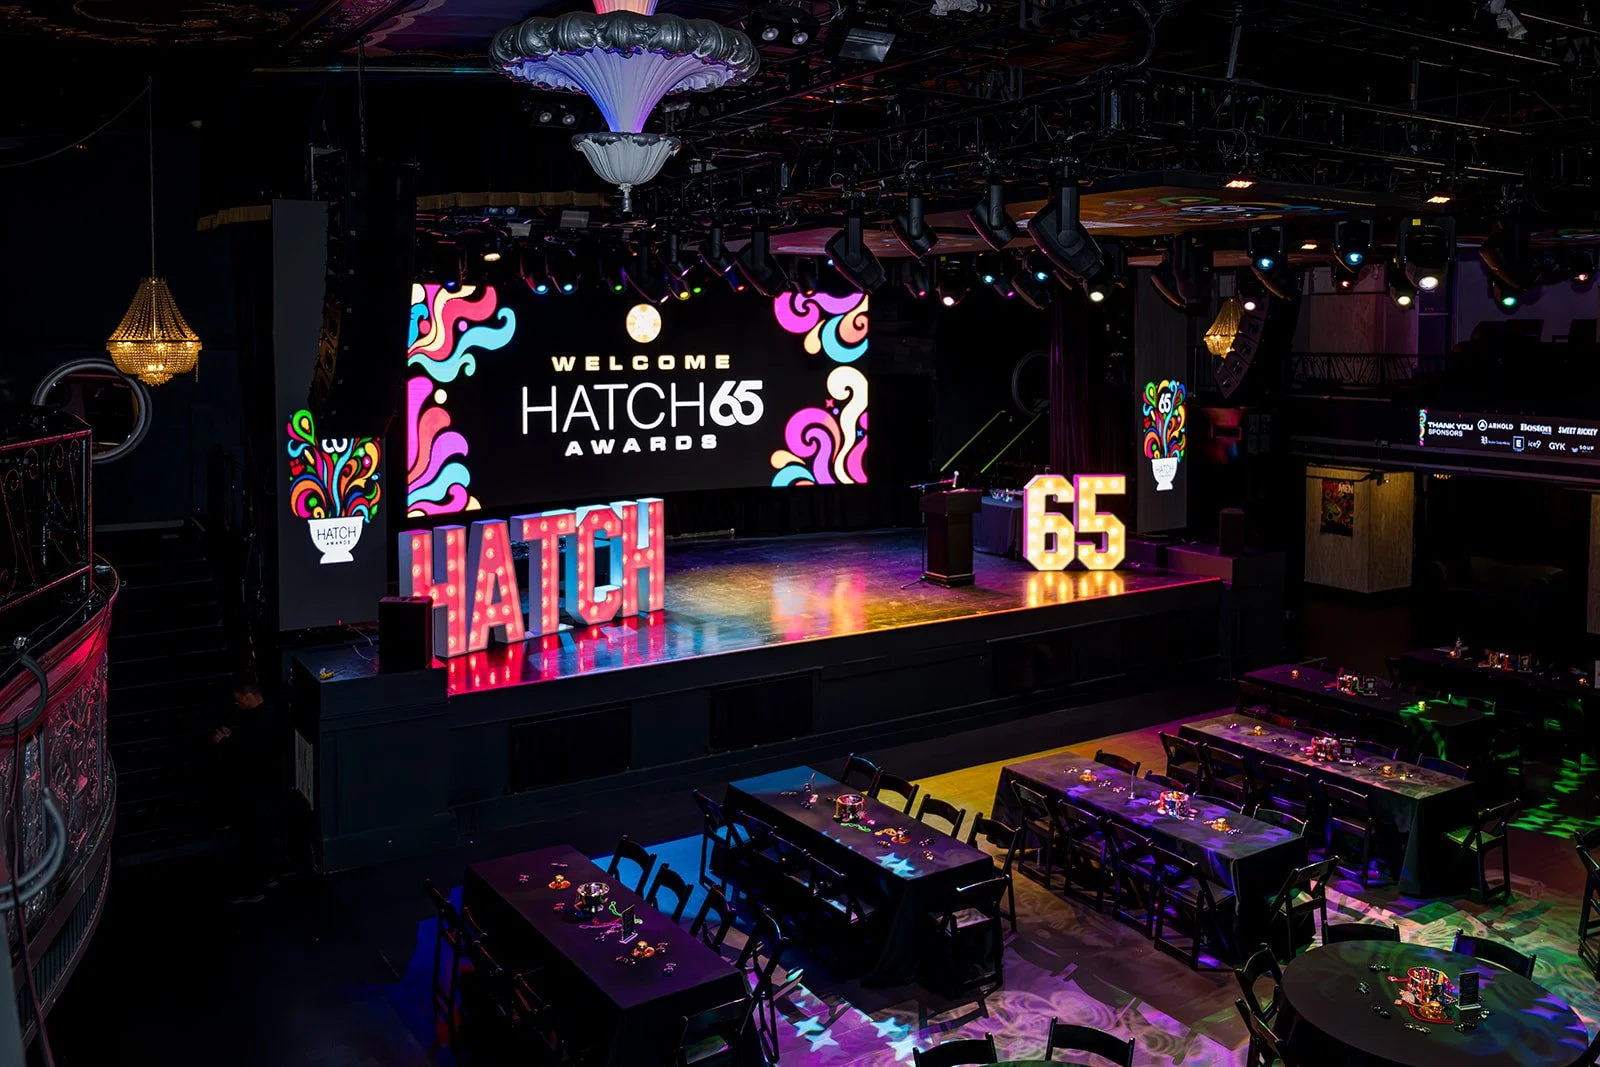
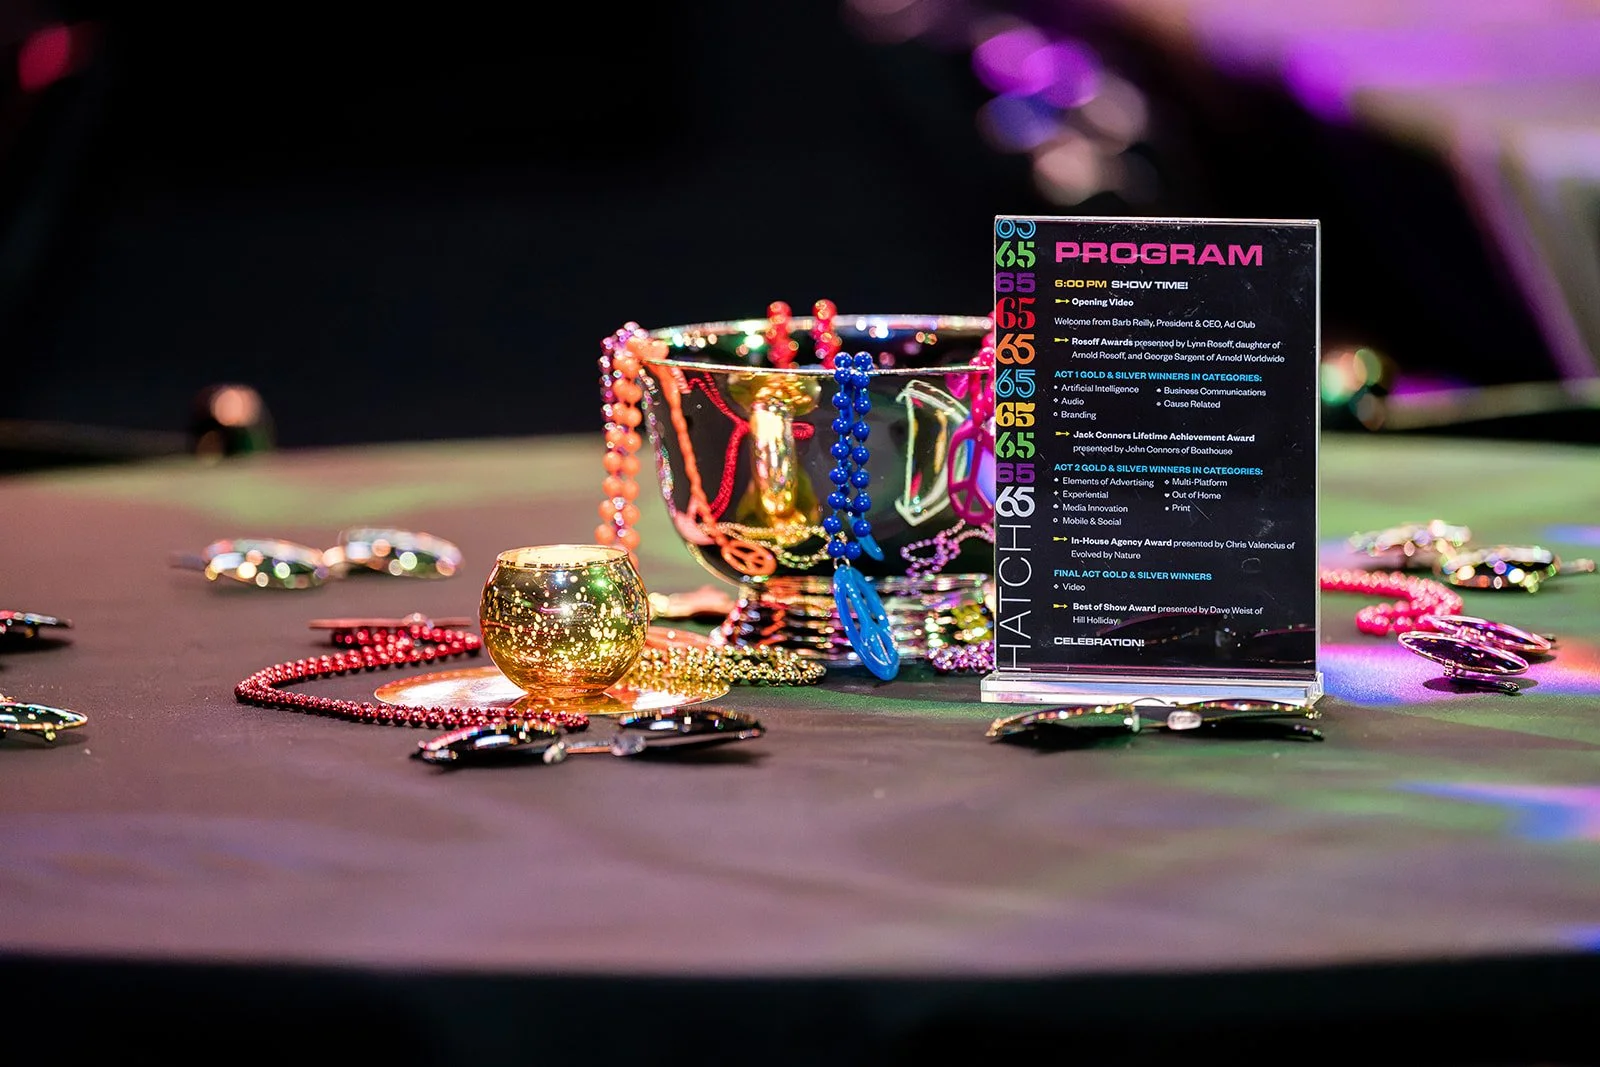
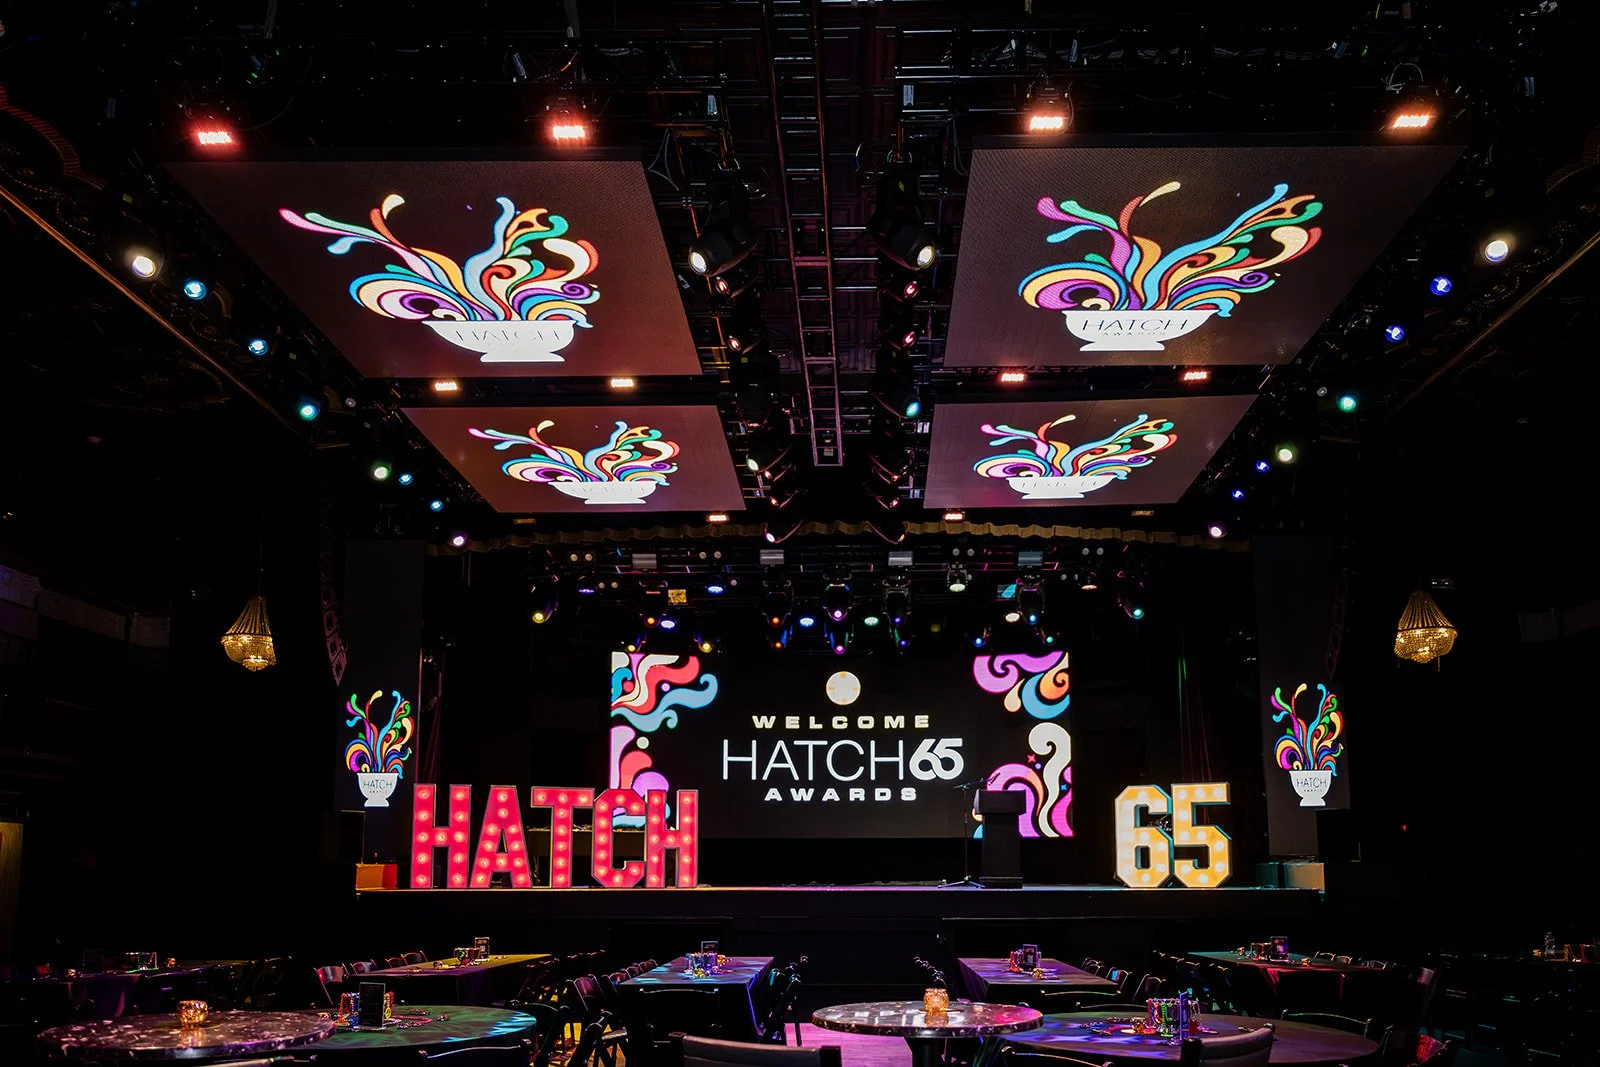
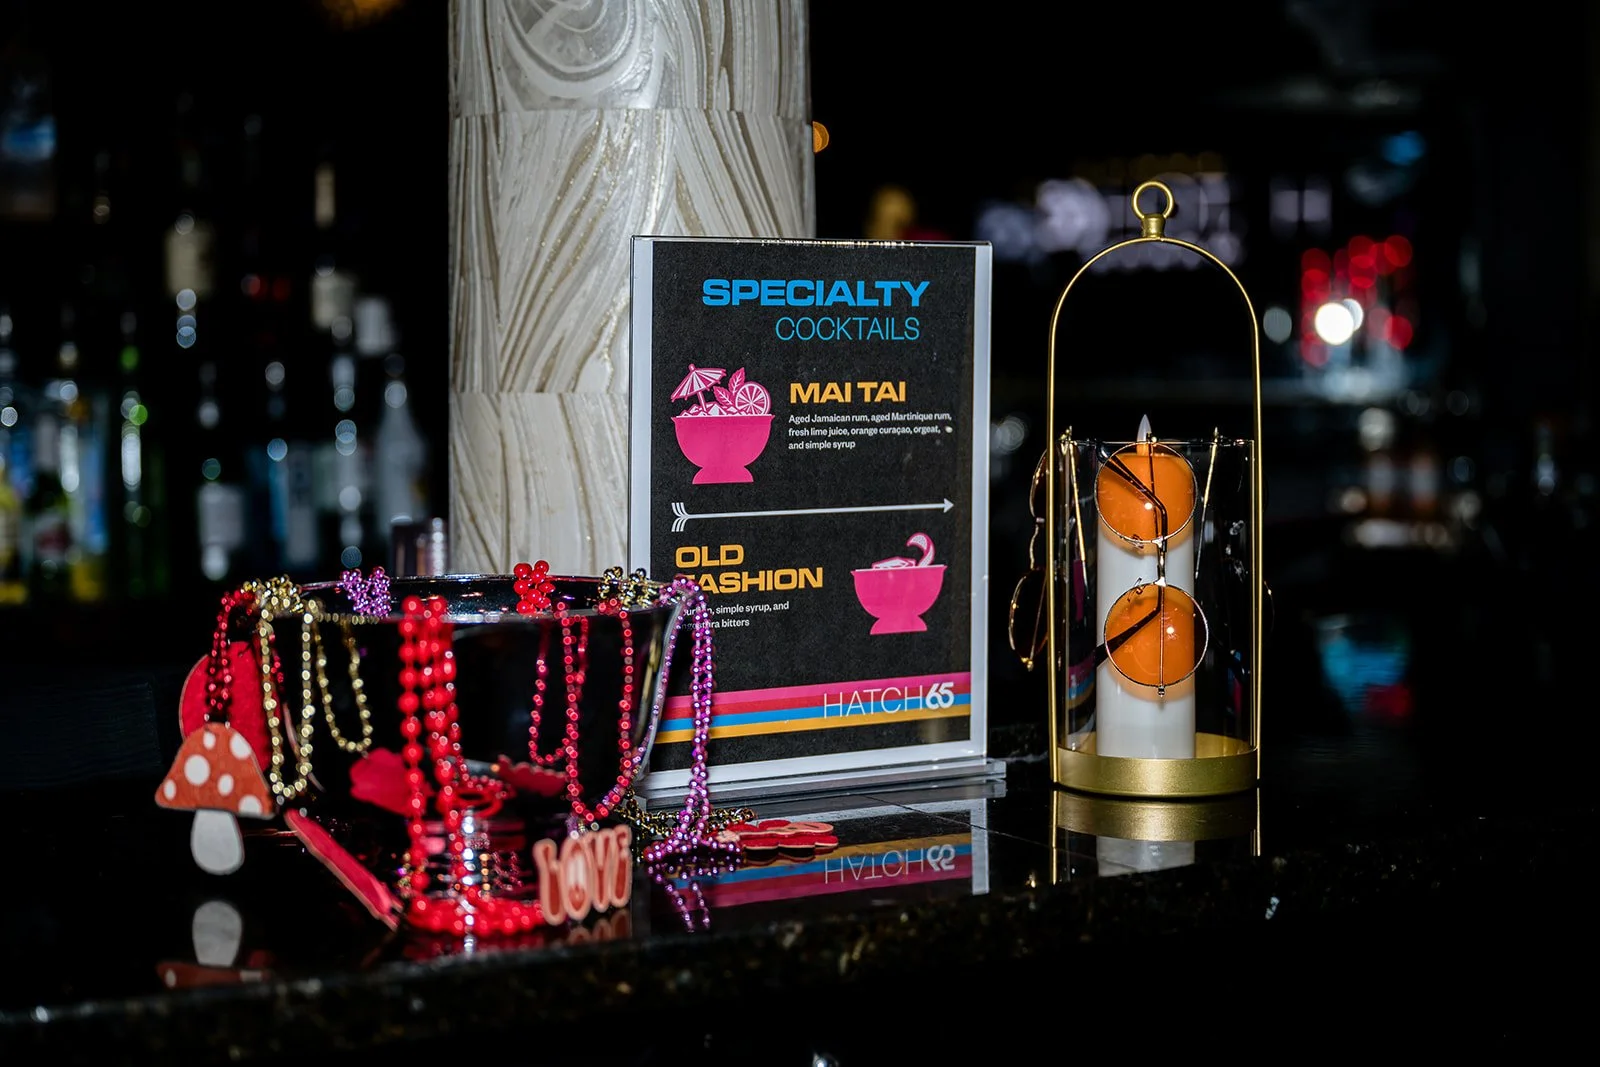
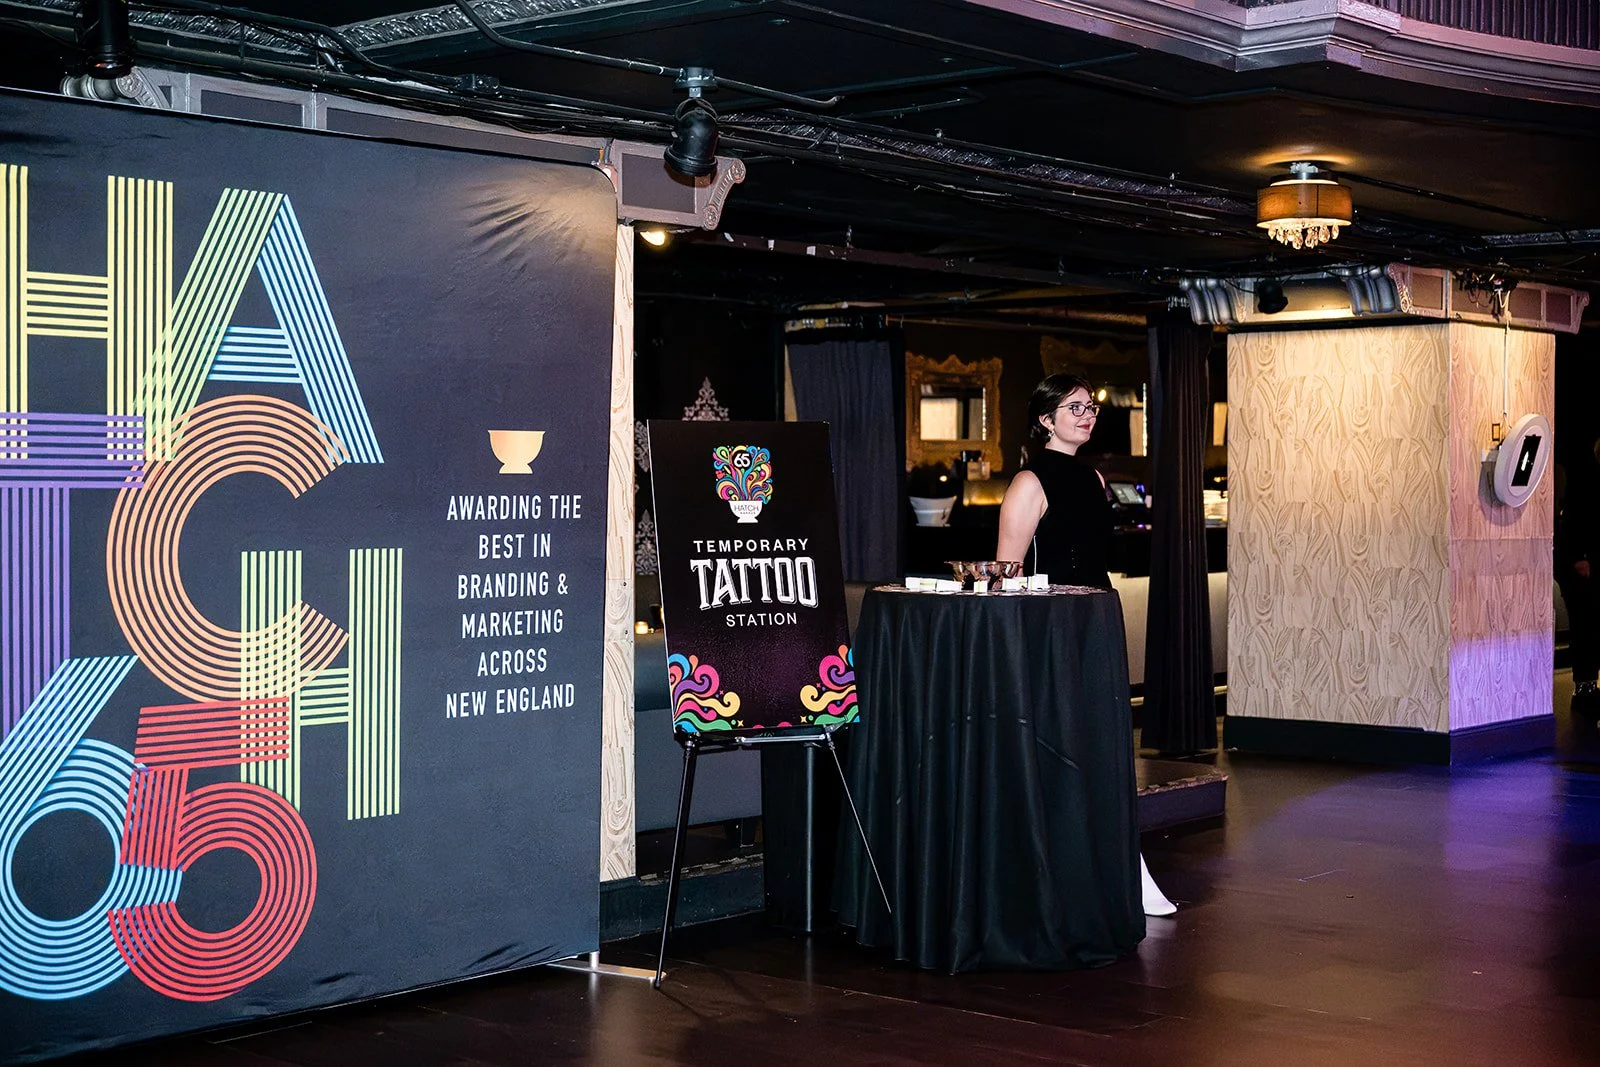
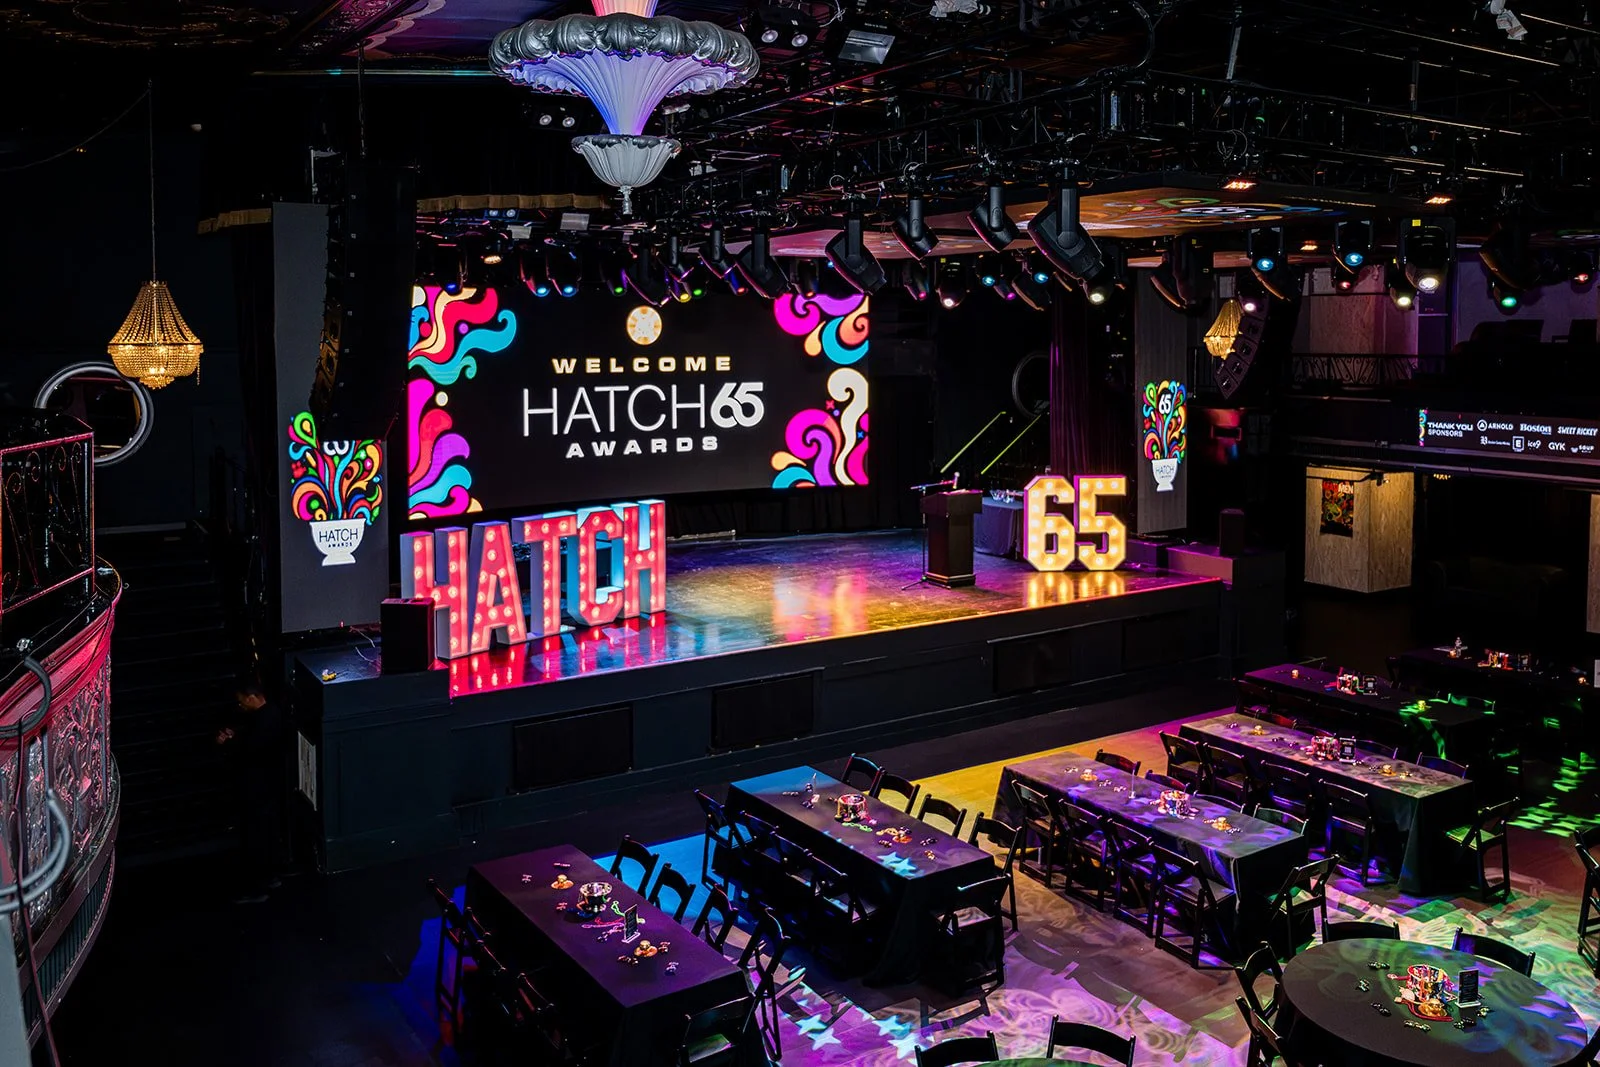
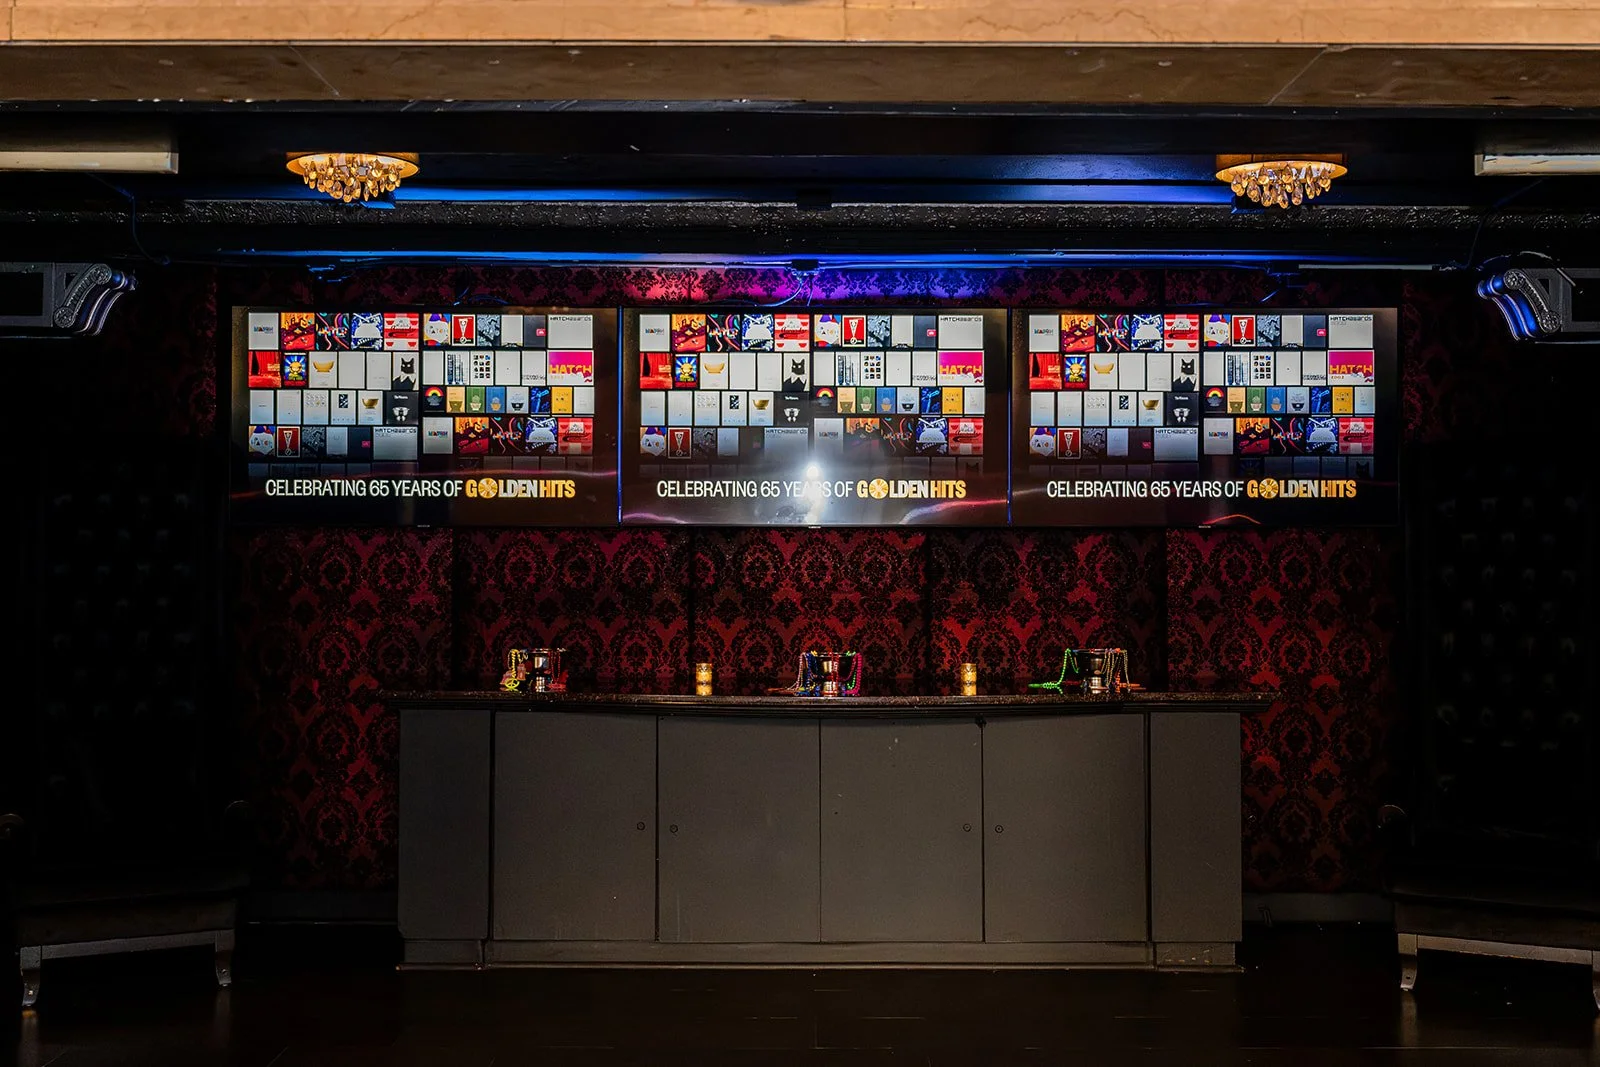
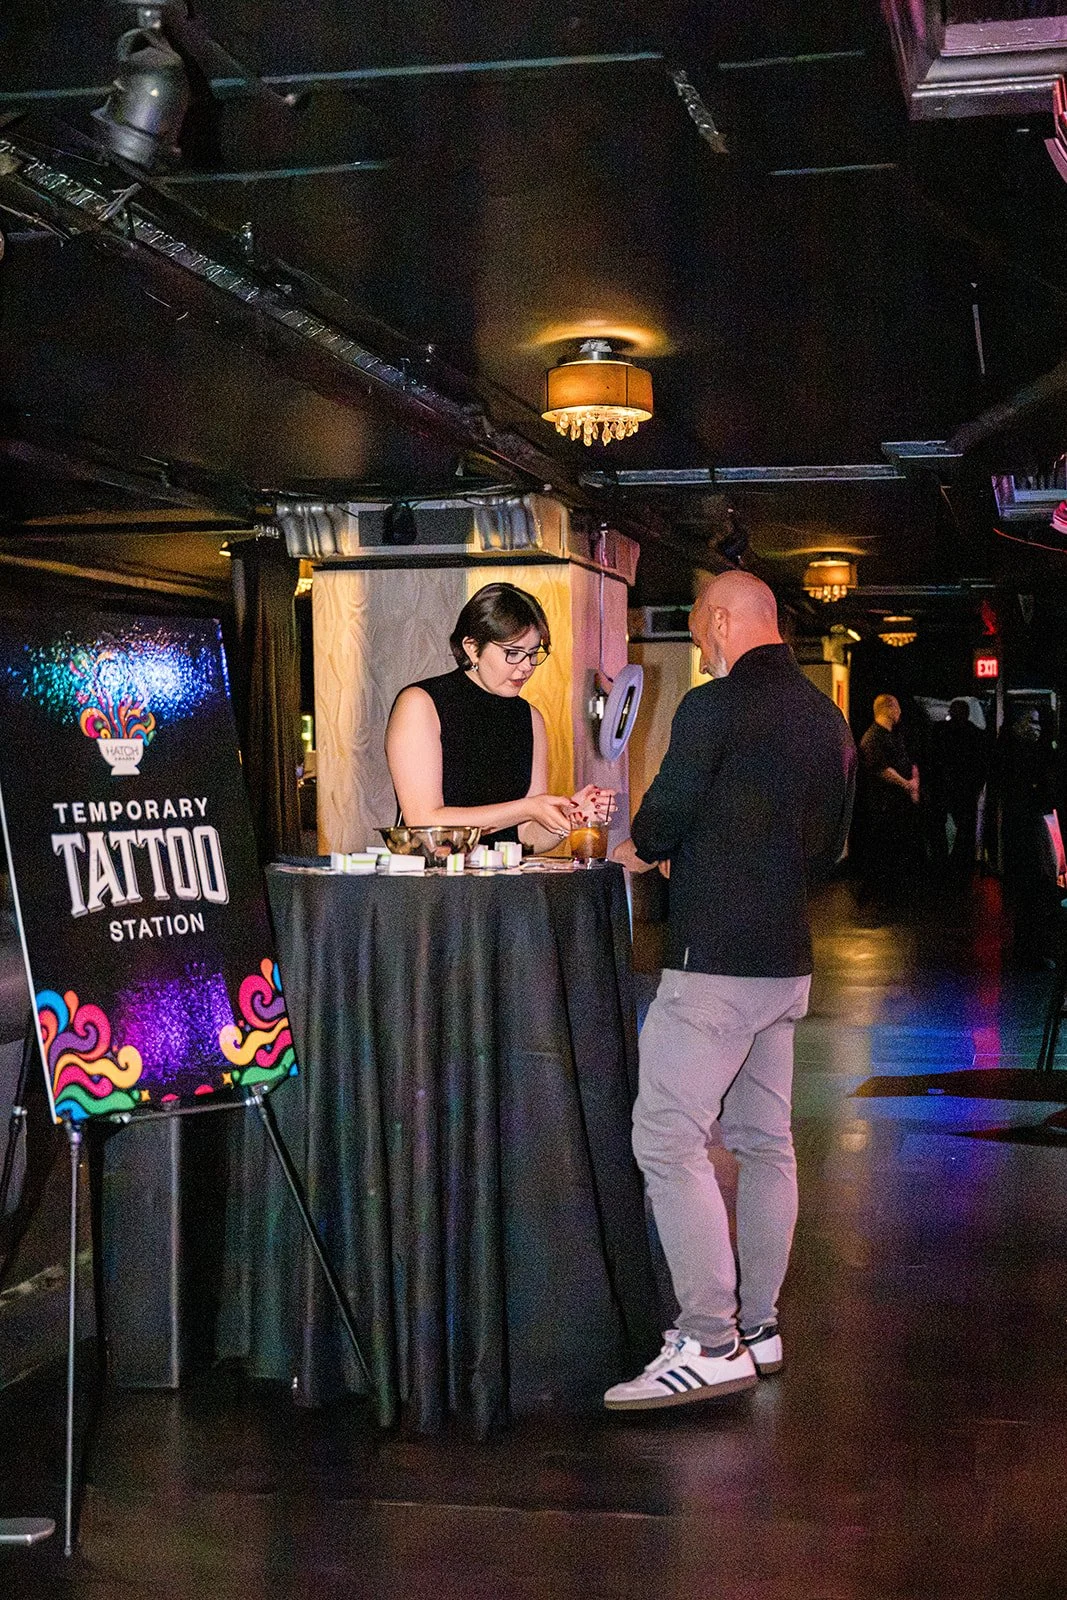
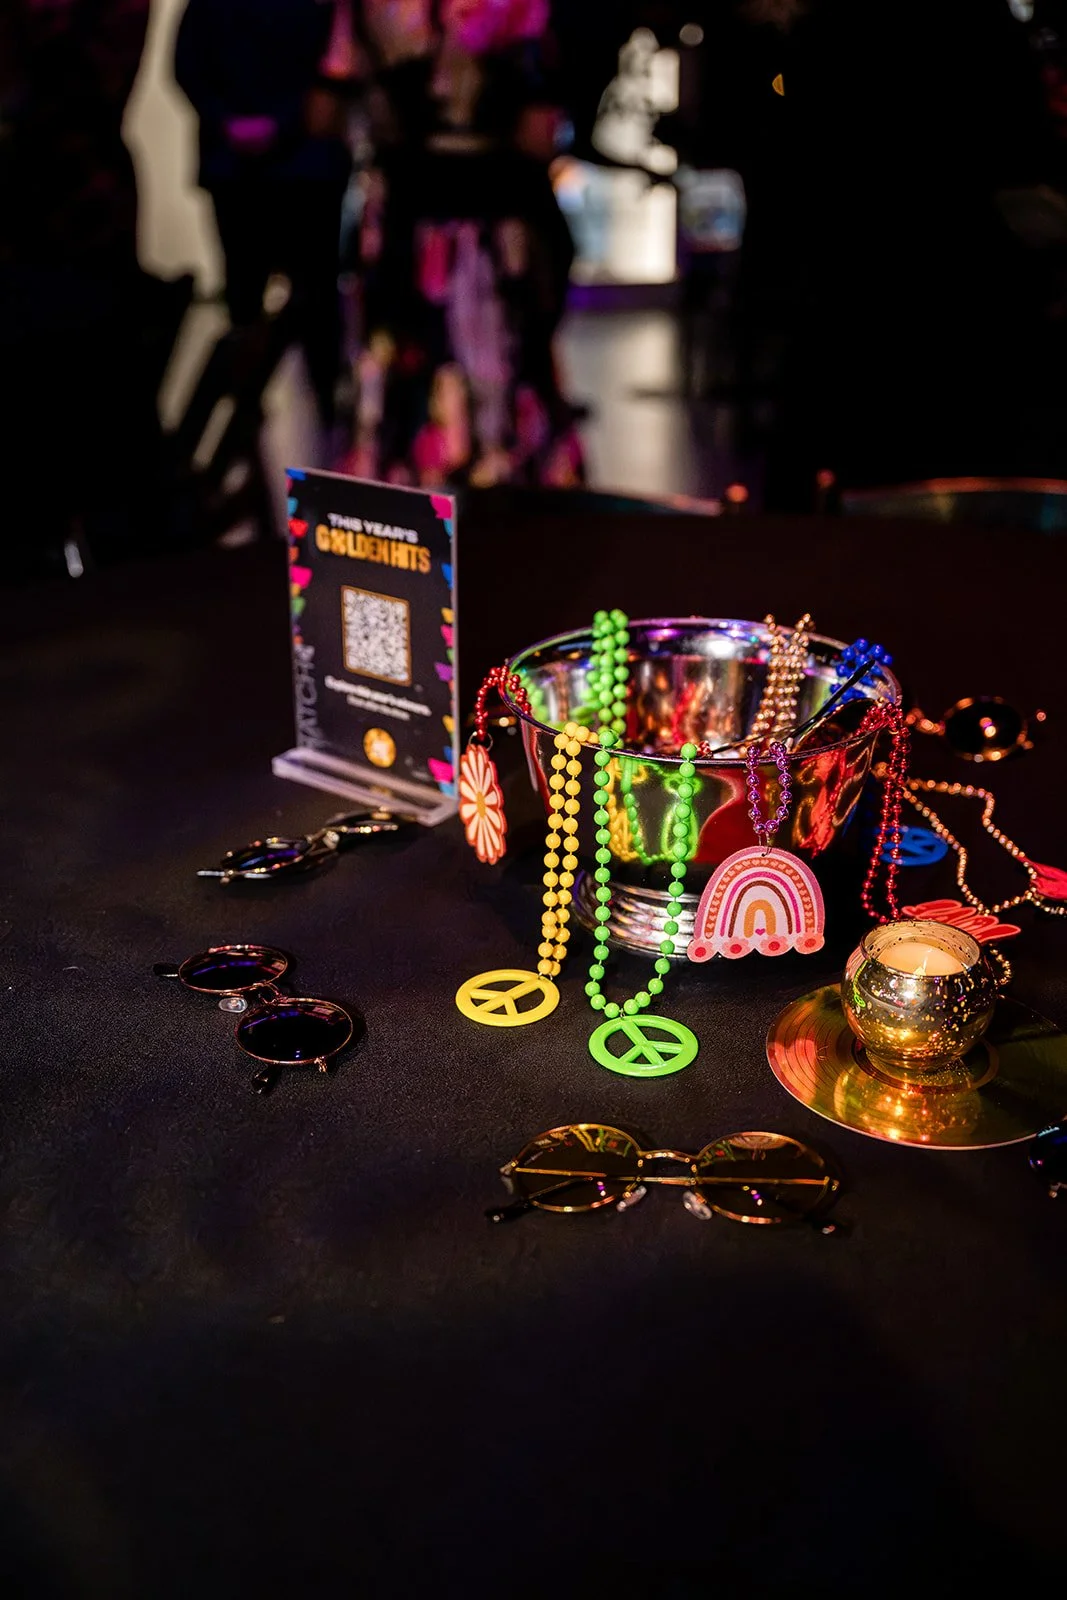
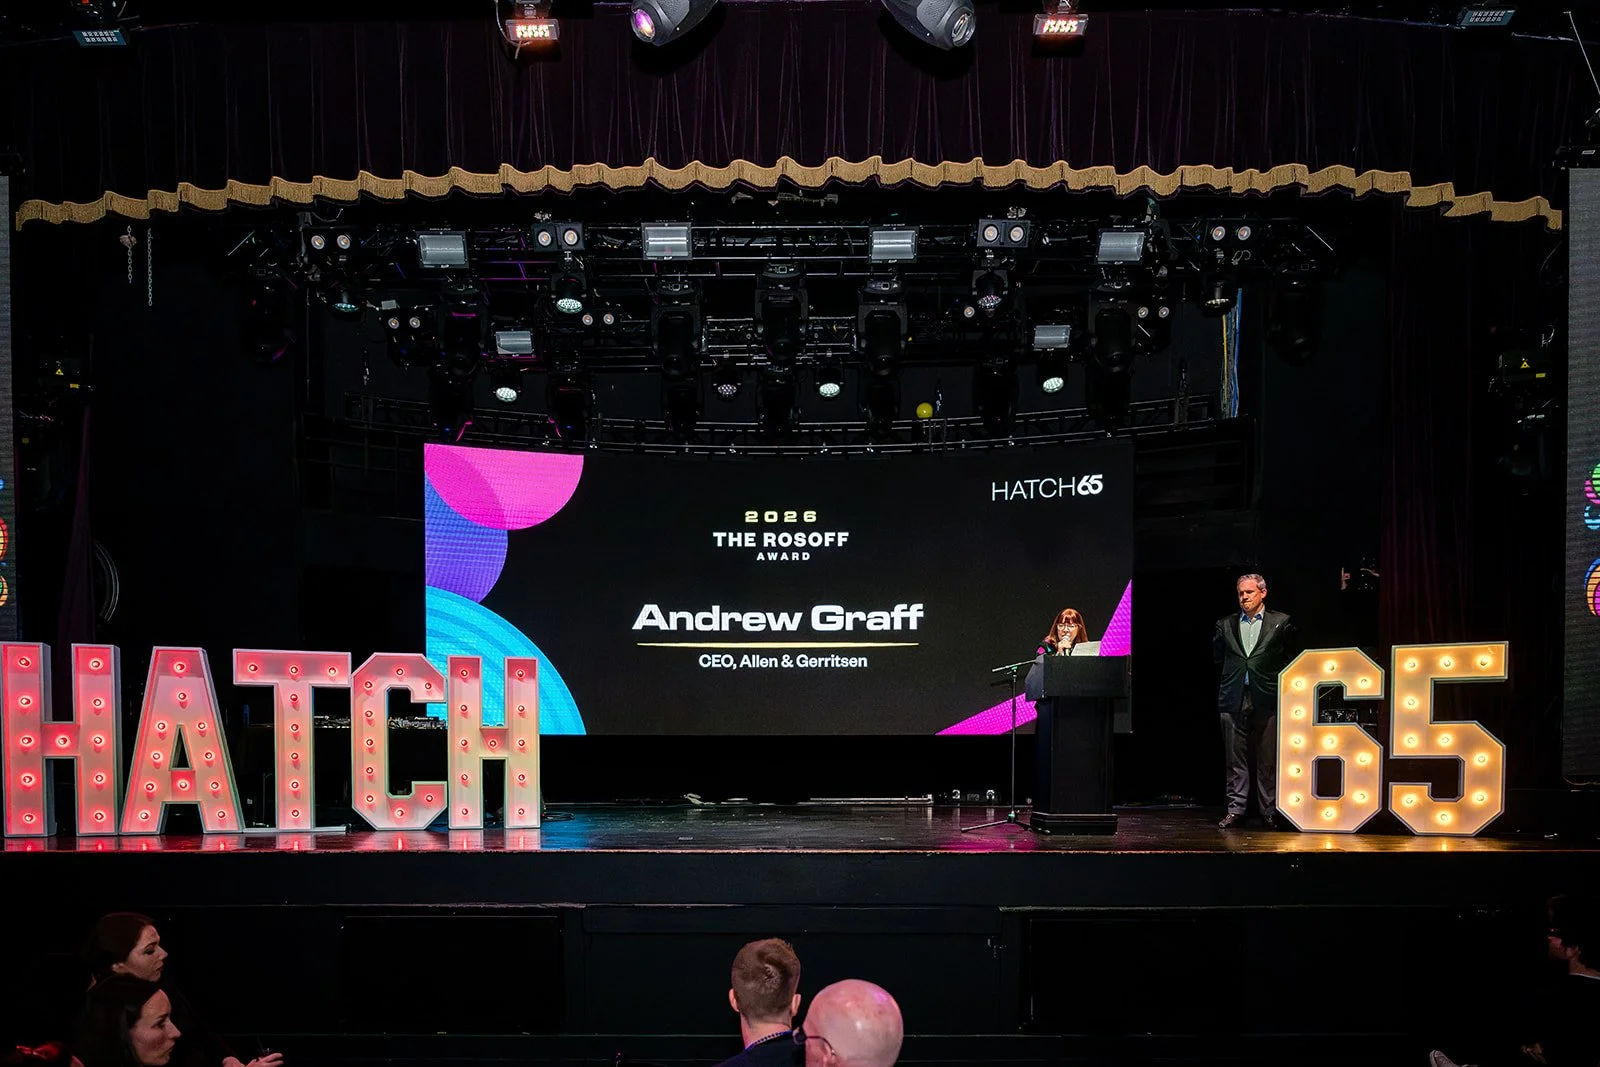
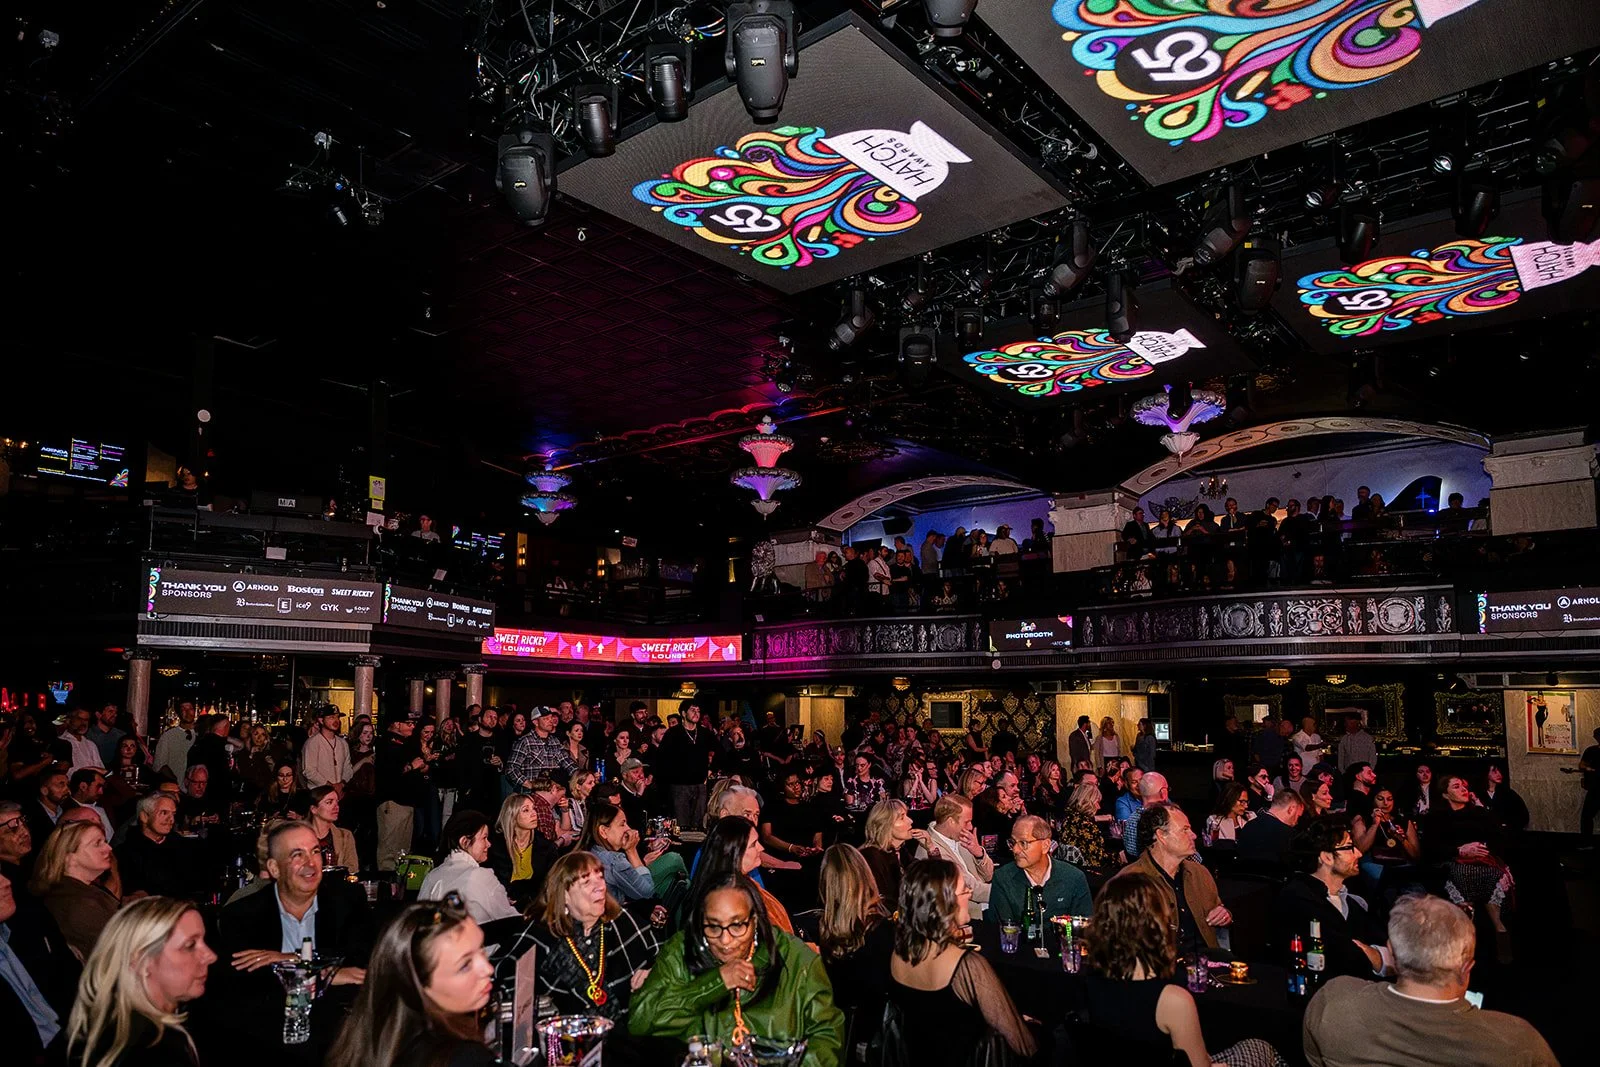
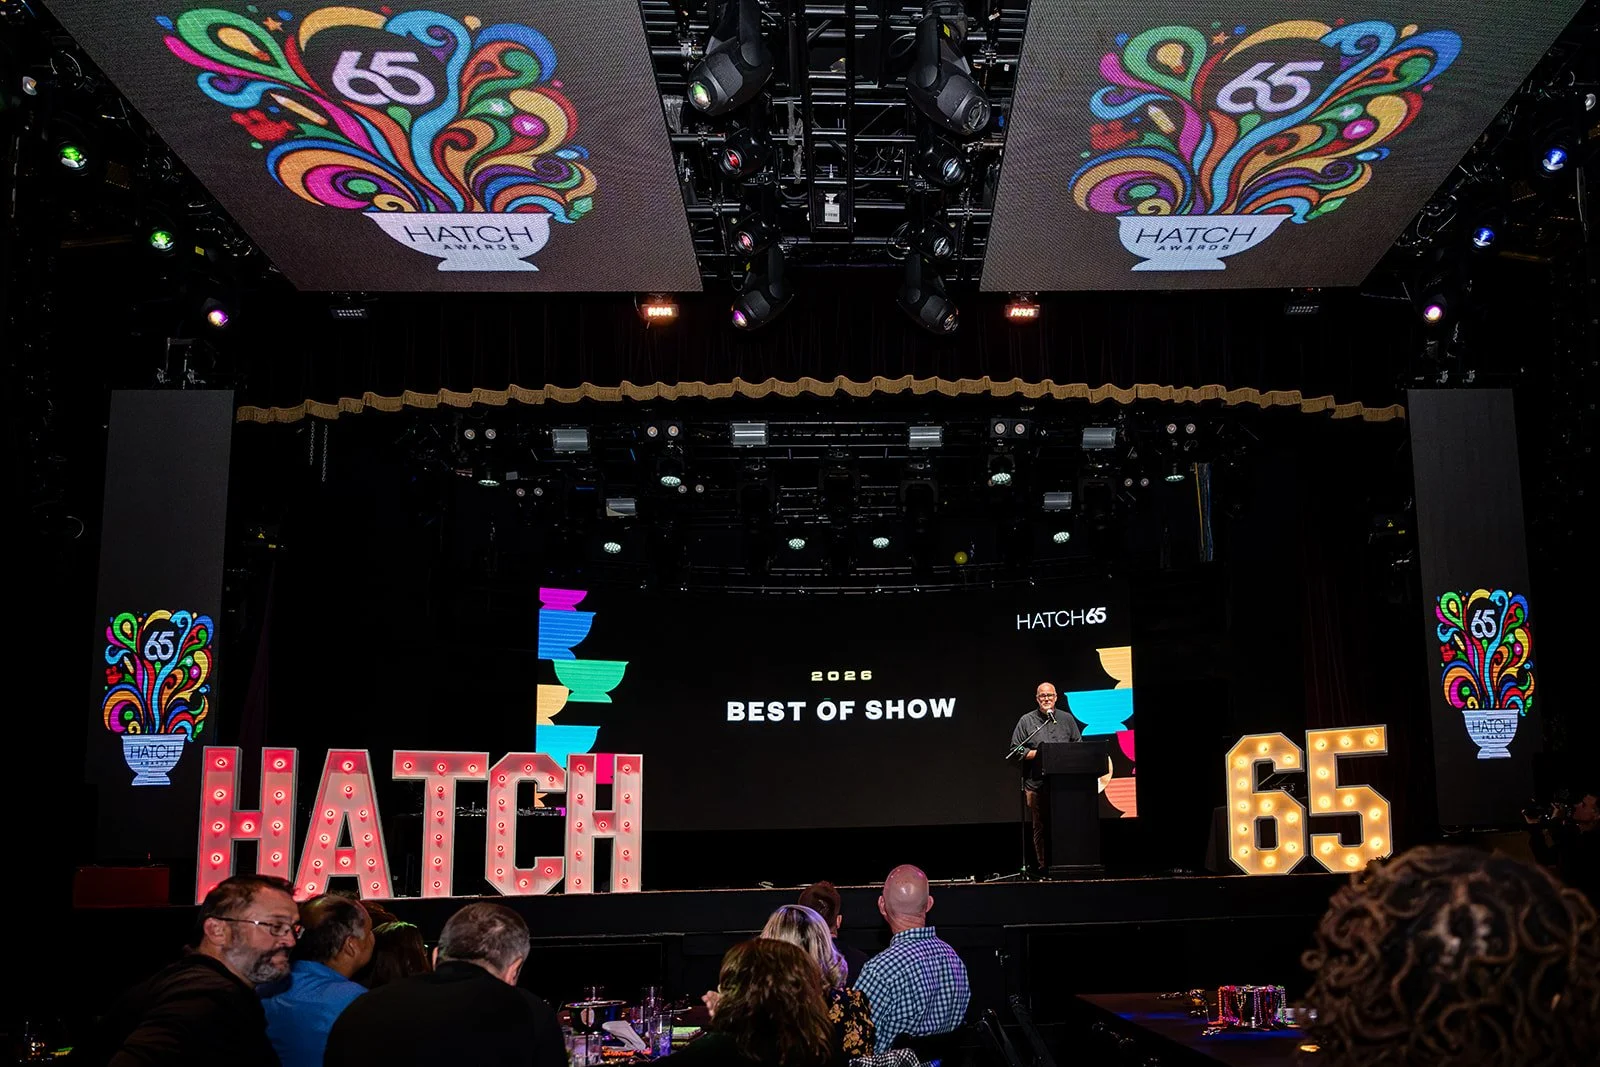
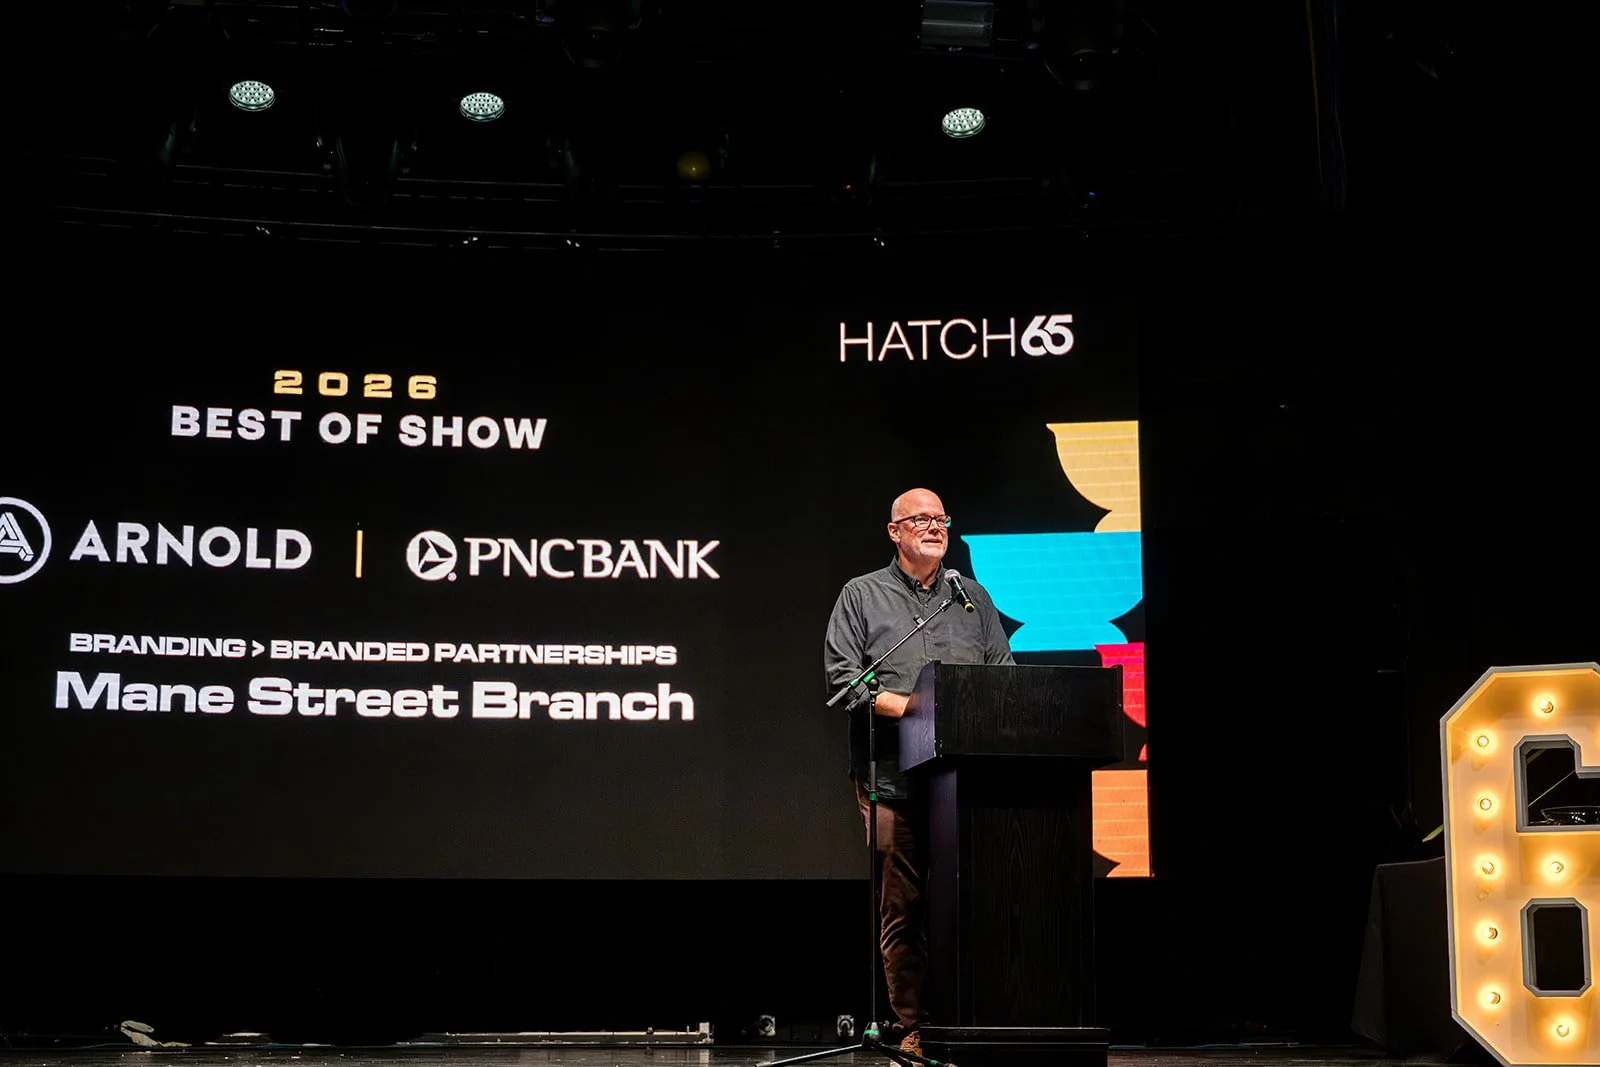
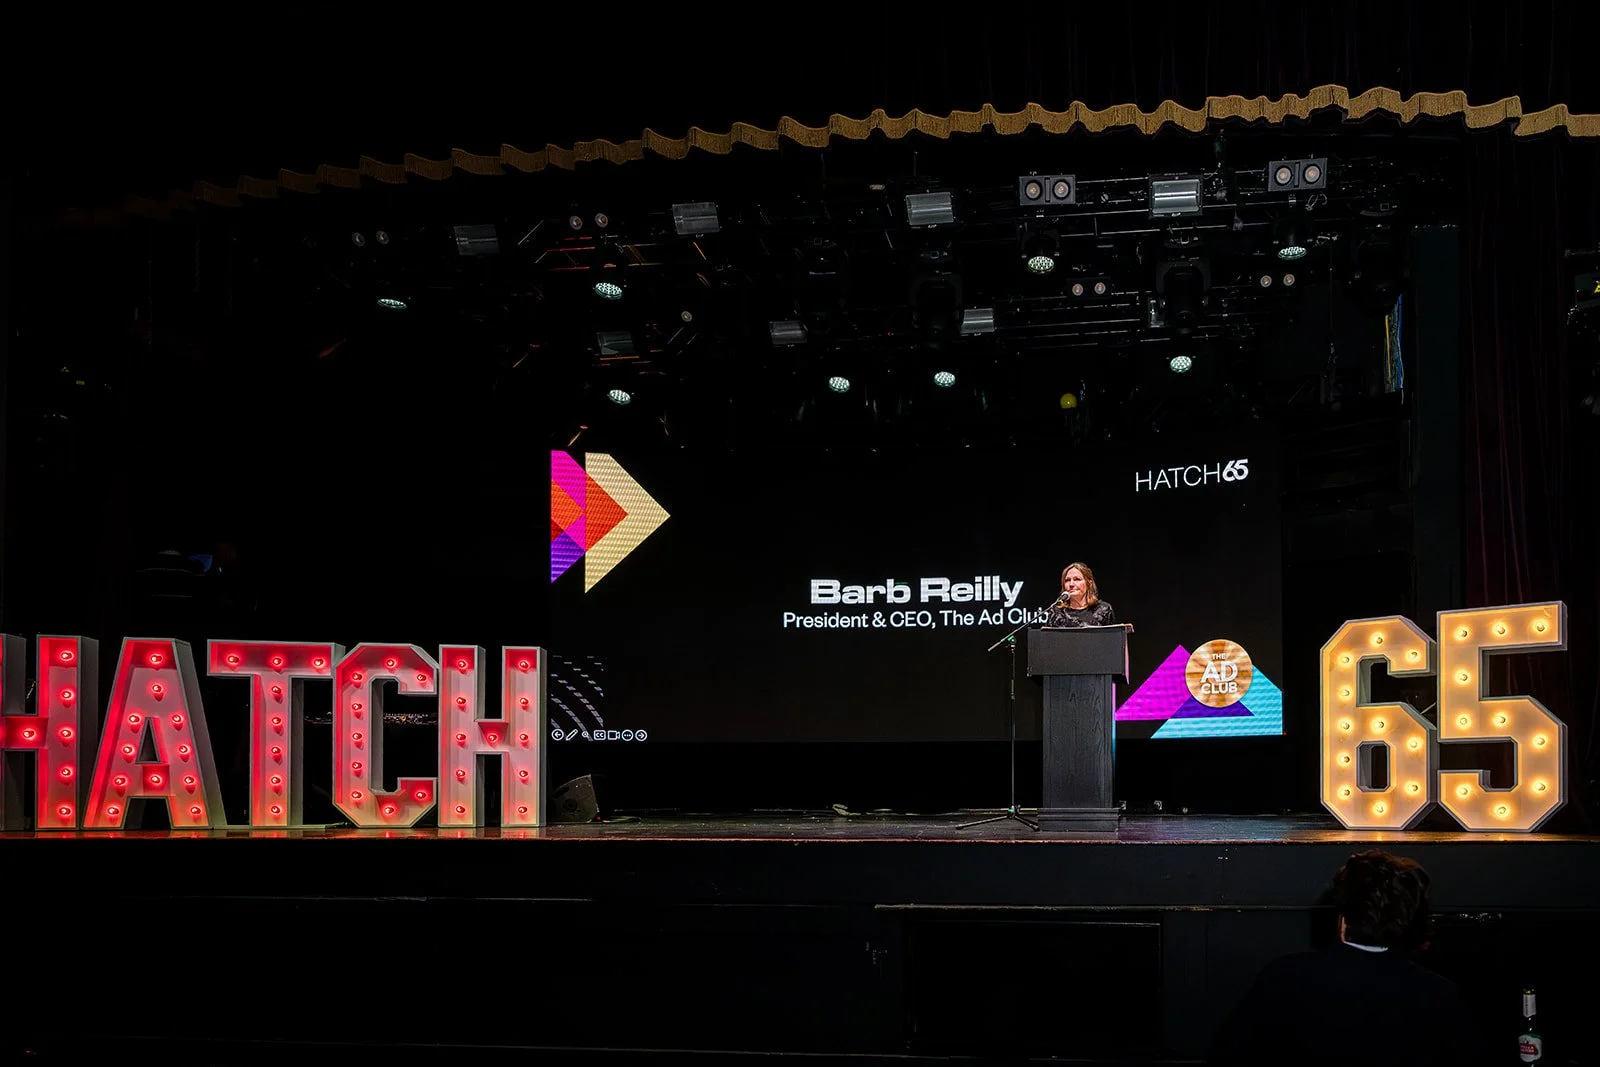
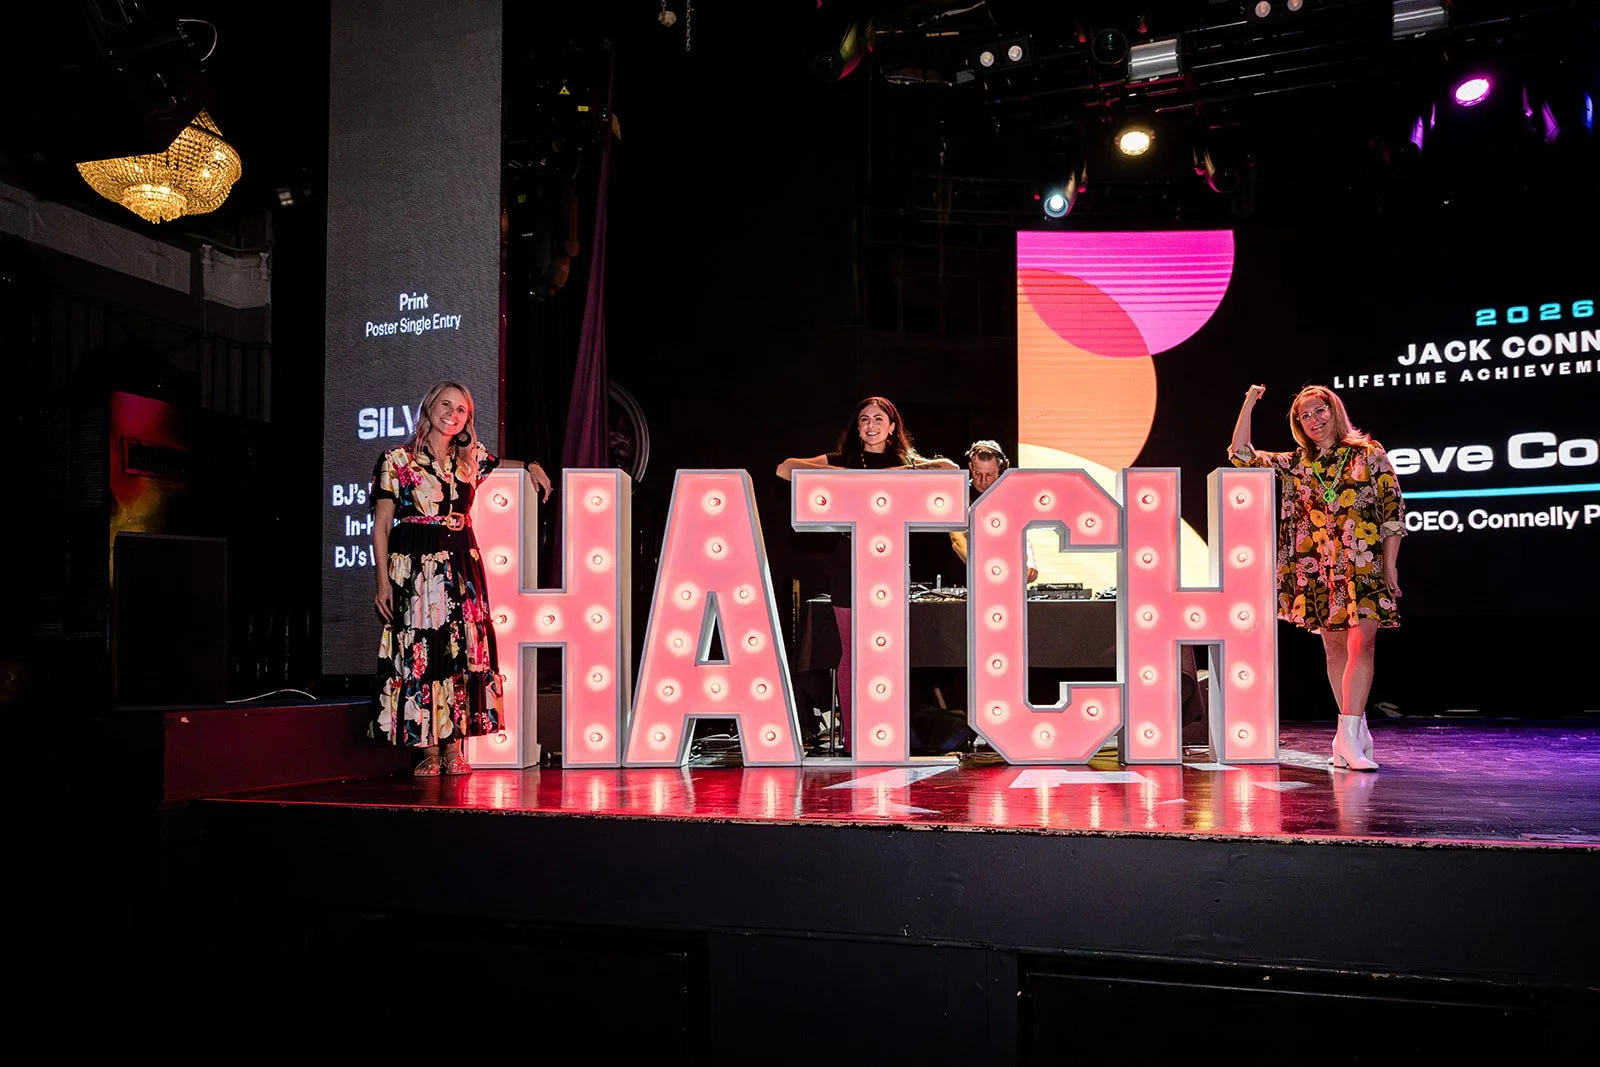
A look at my designs in action at the 65th Annual Hatch Awards. Photography by the event photographers.