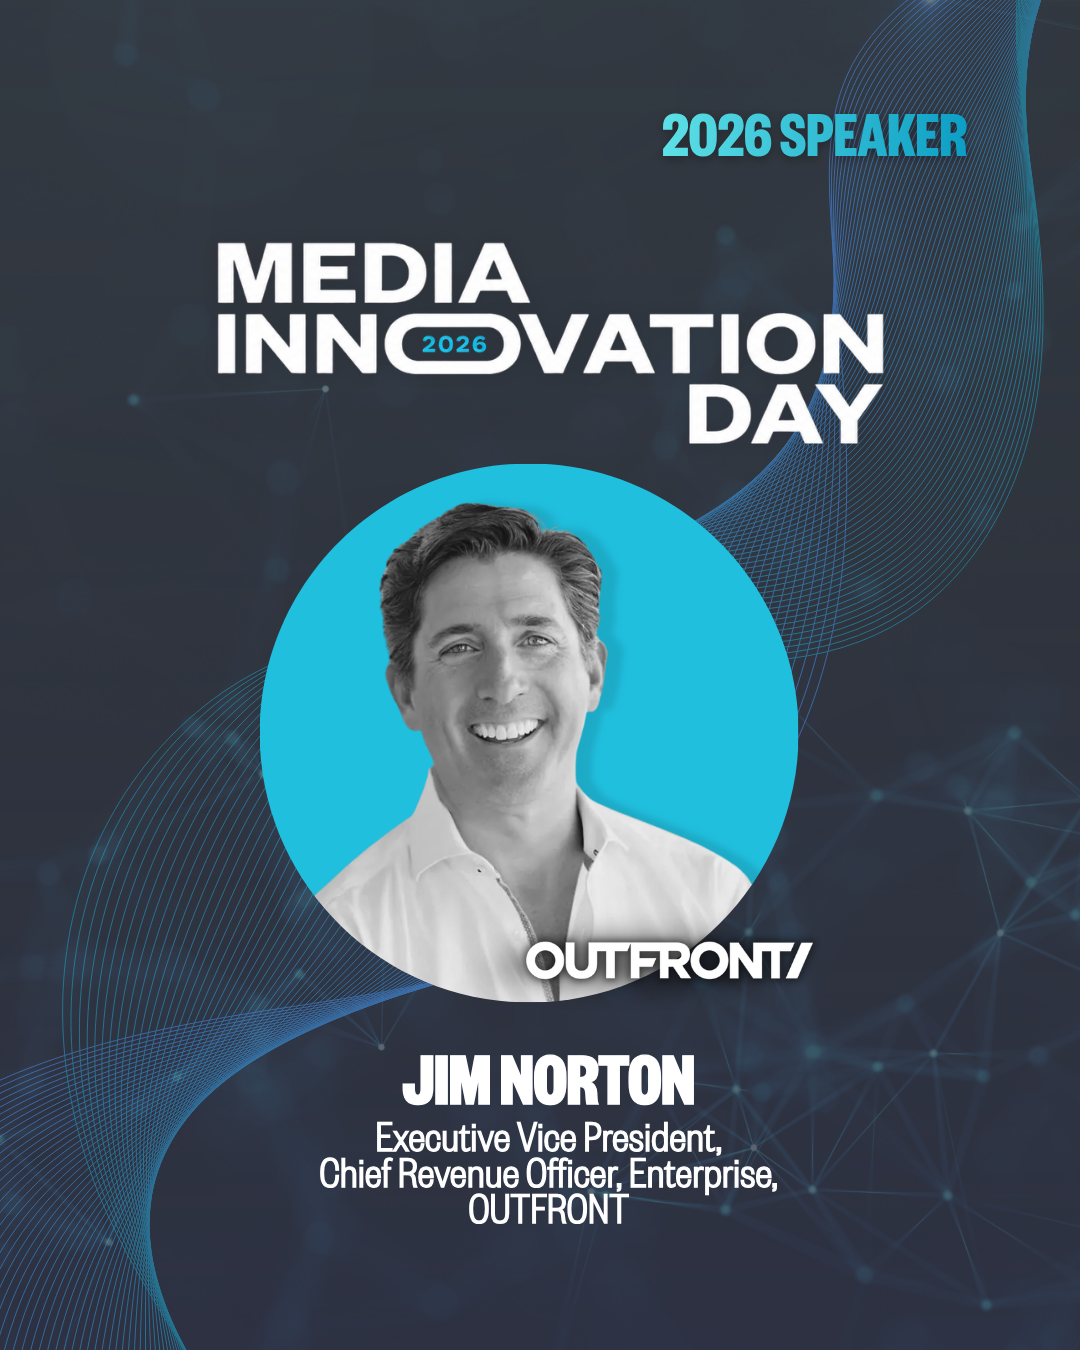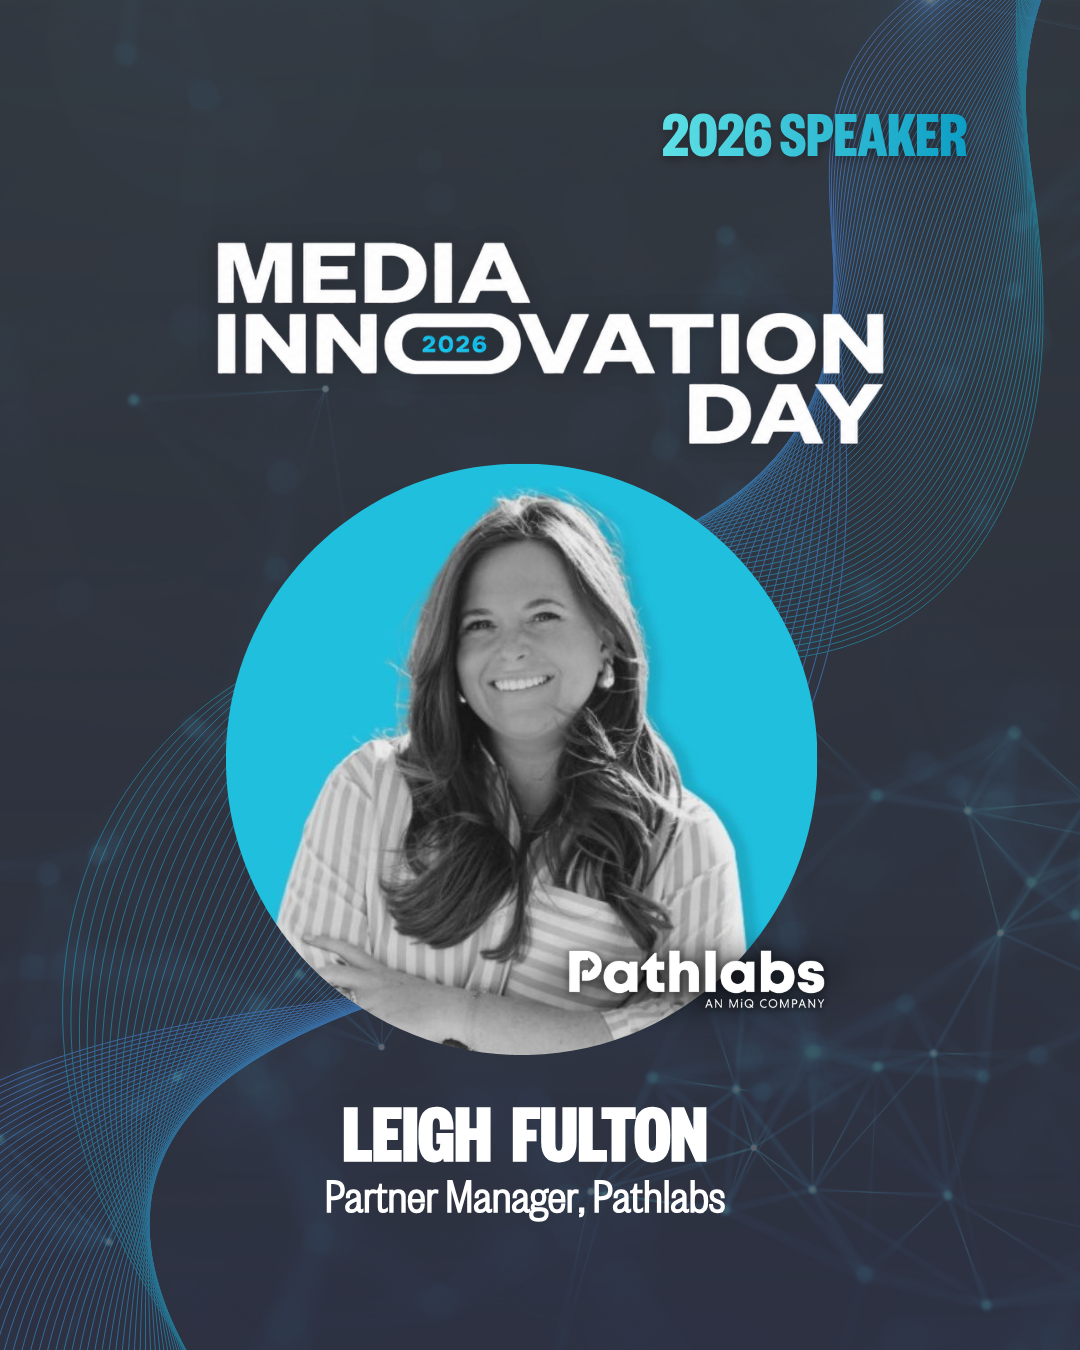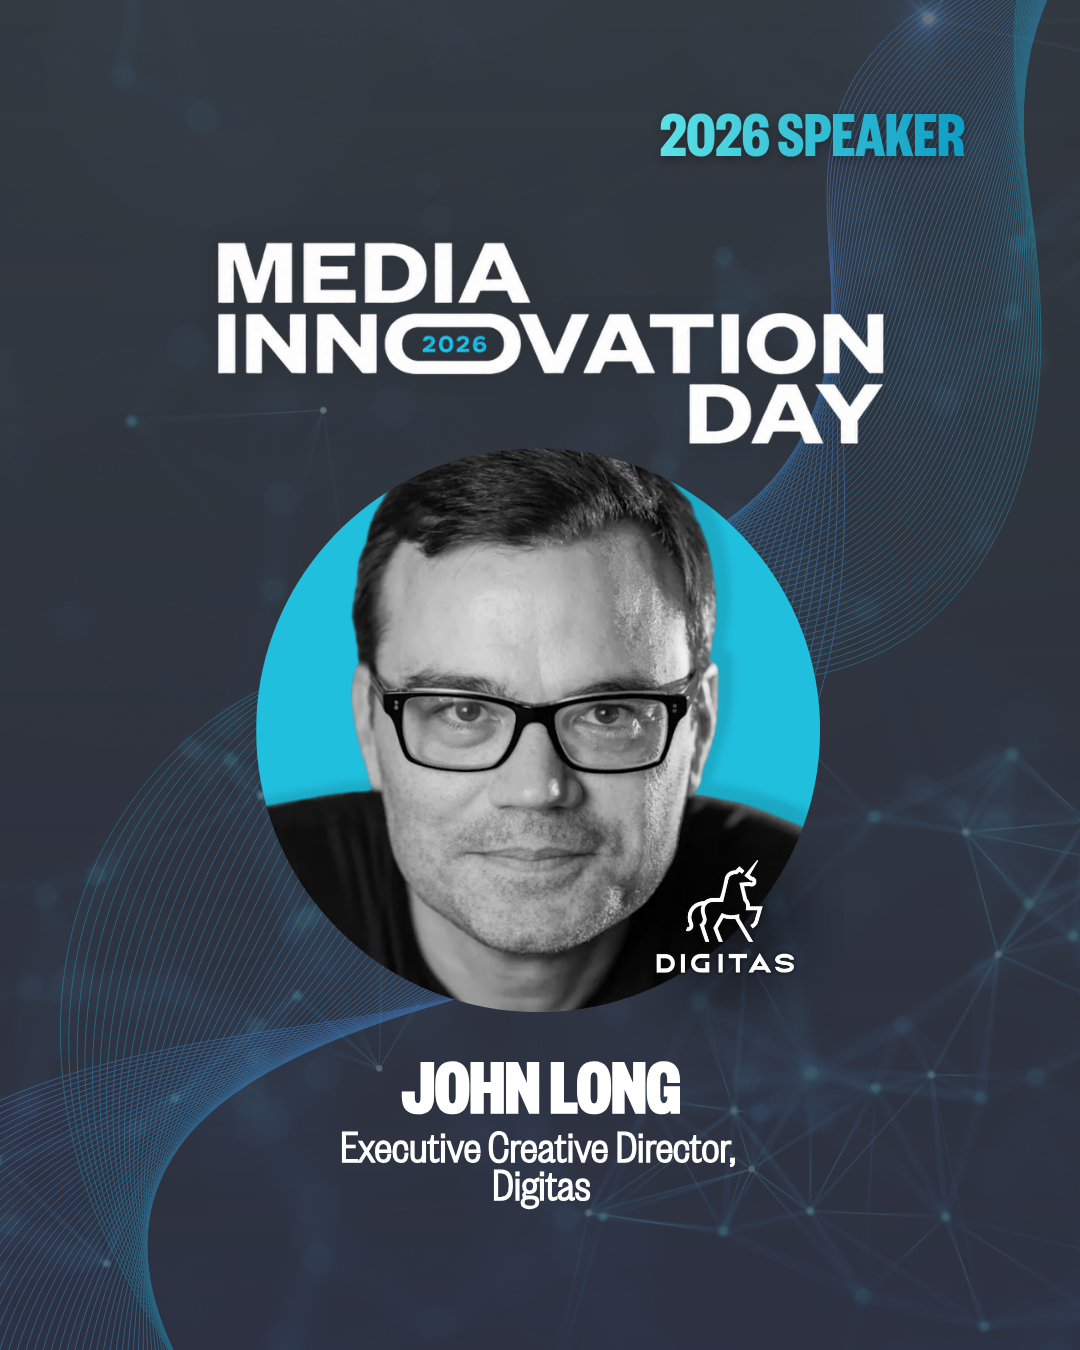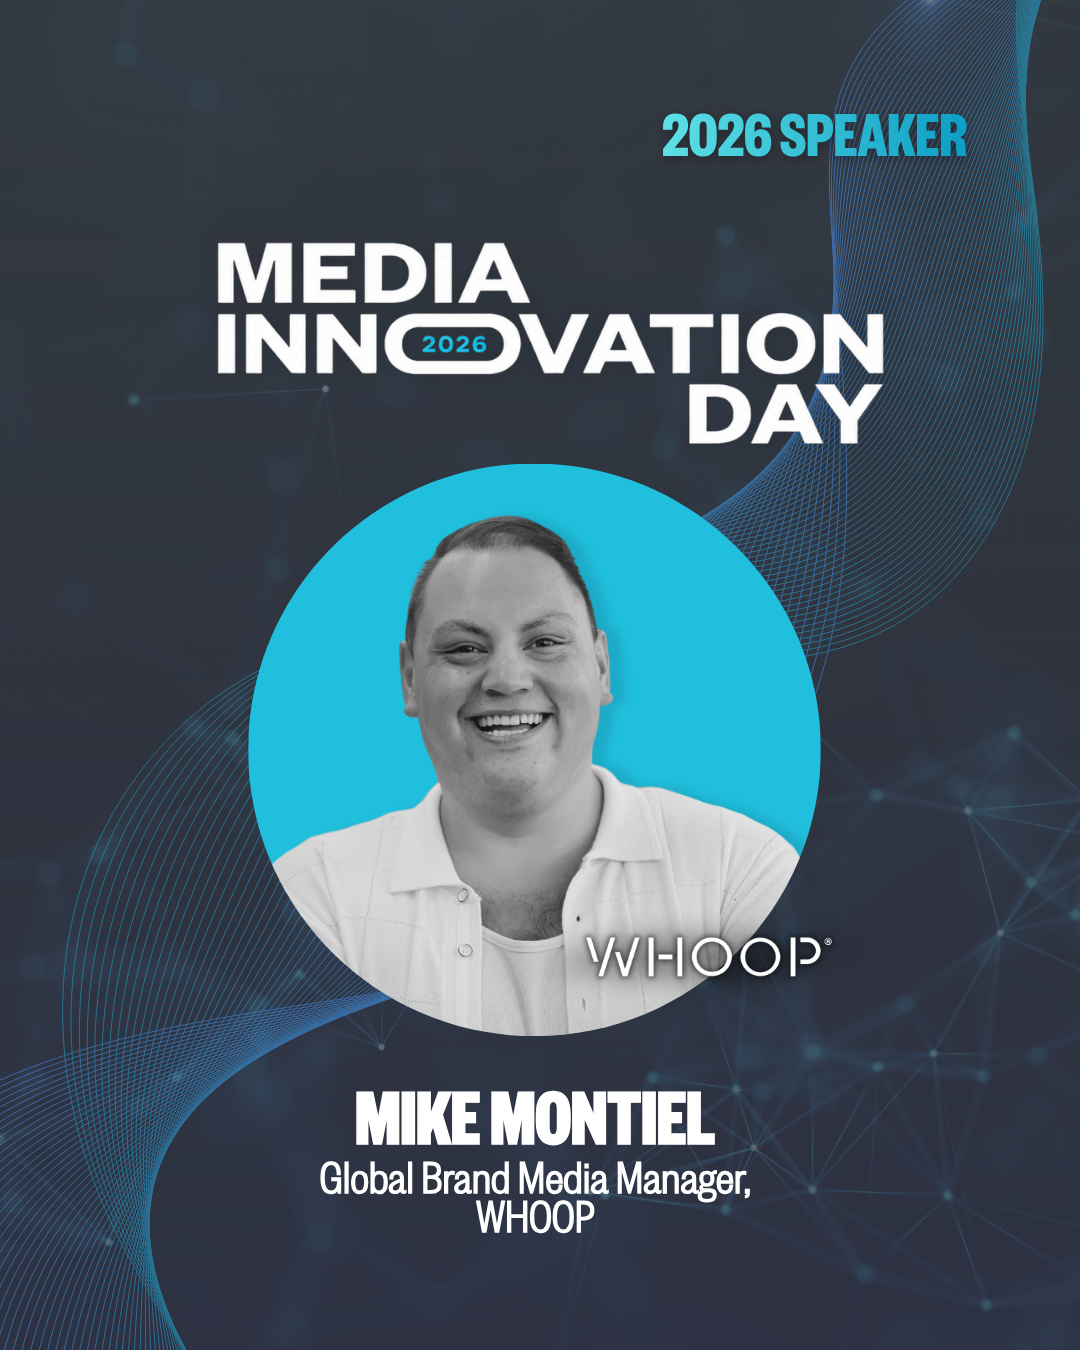
The Ad Club · 2026
Media Innovation Day
Design · Digital Marketing · Community Engagement
Executive Summary
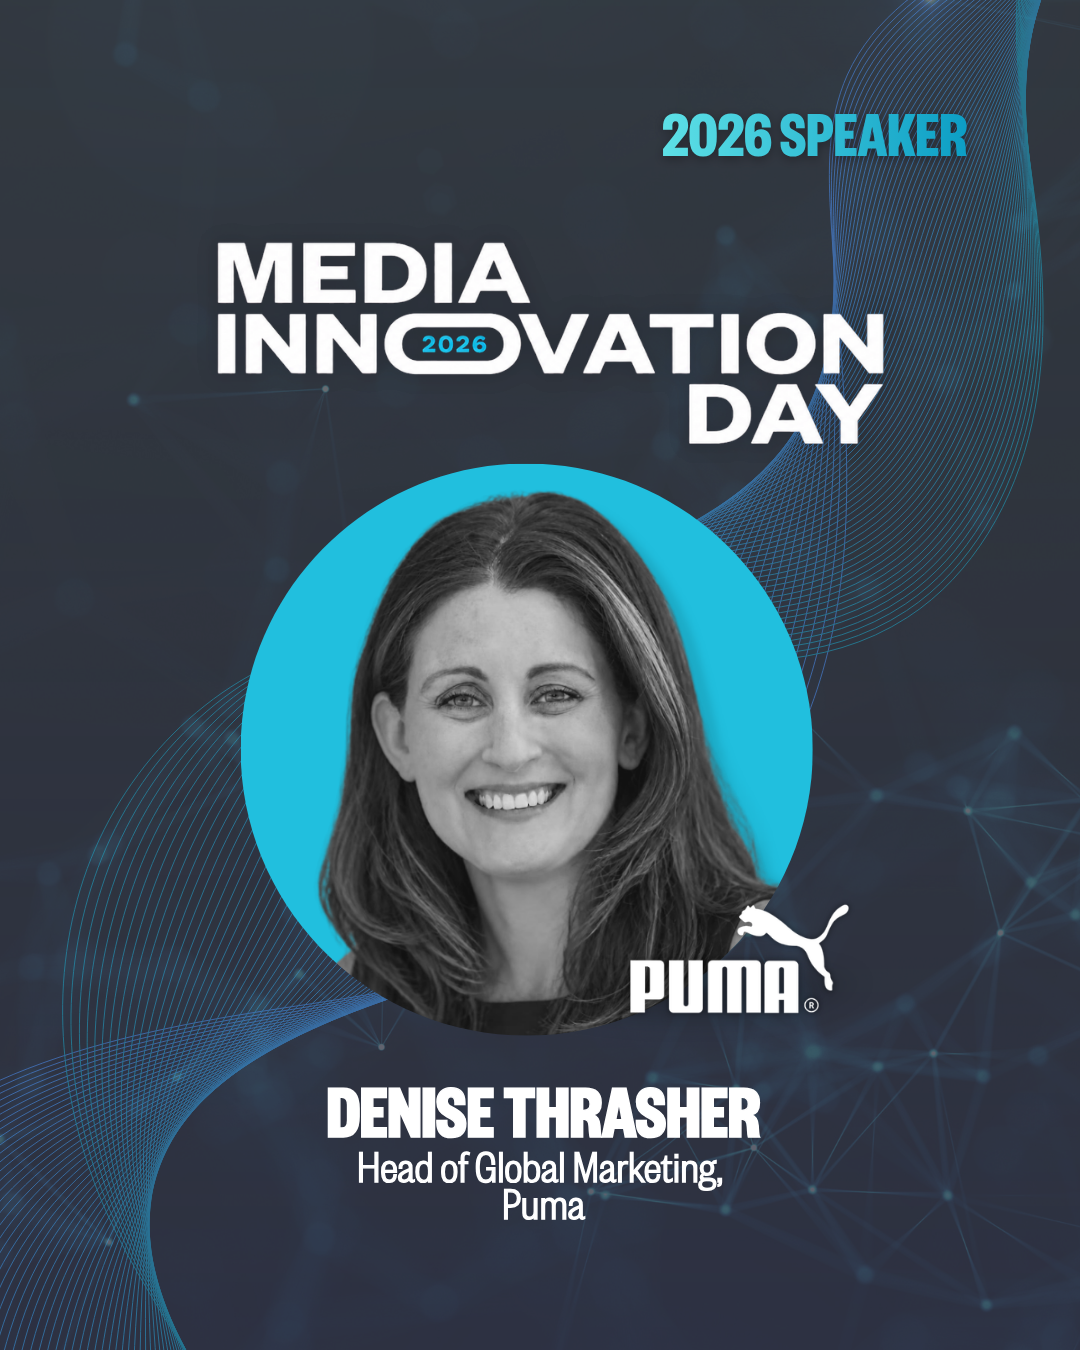
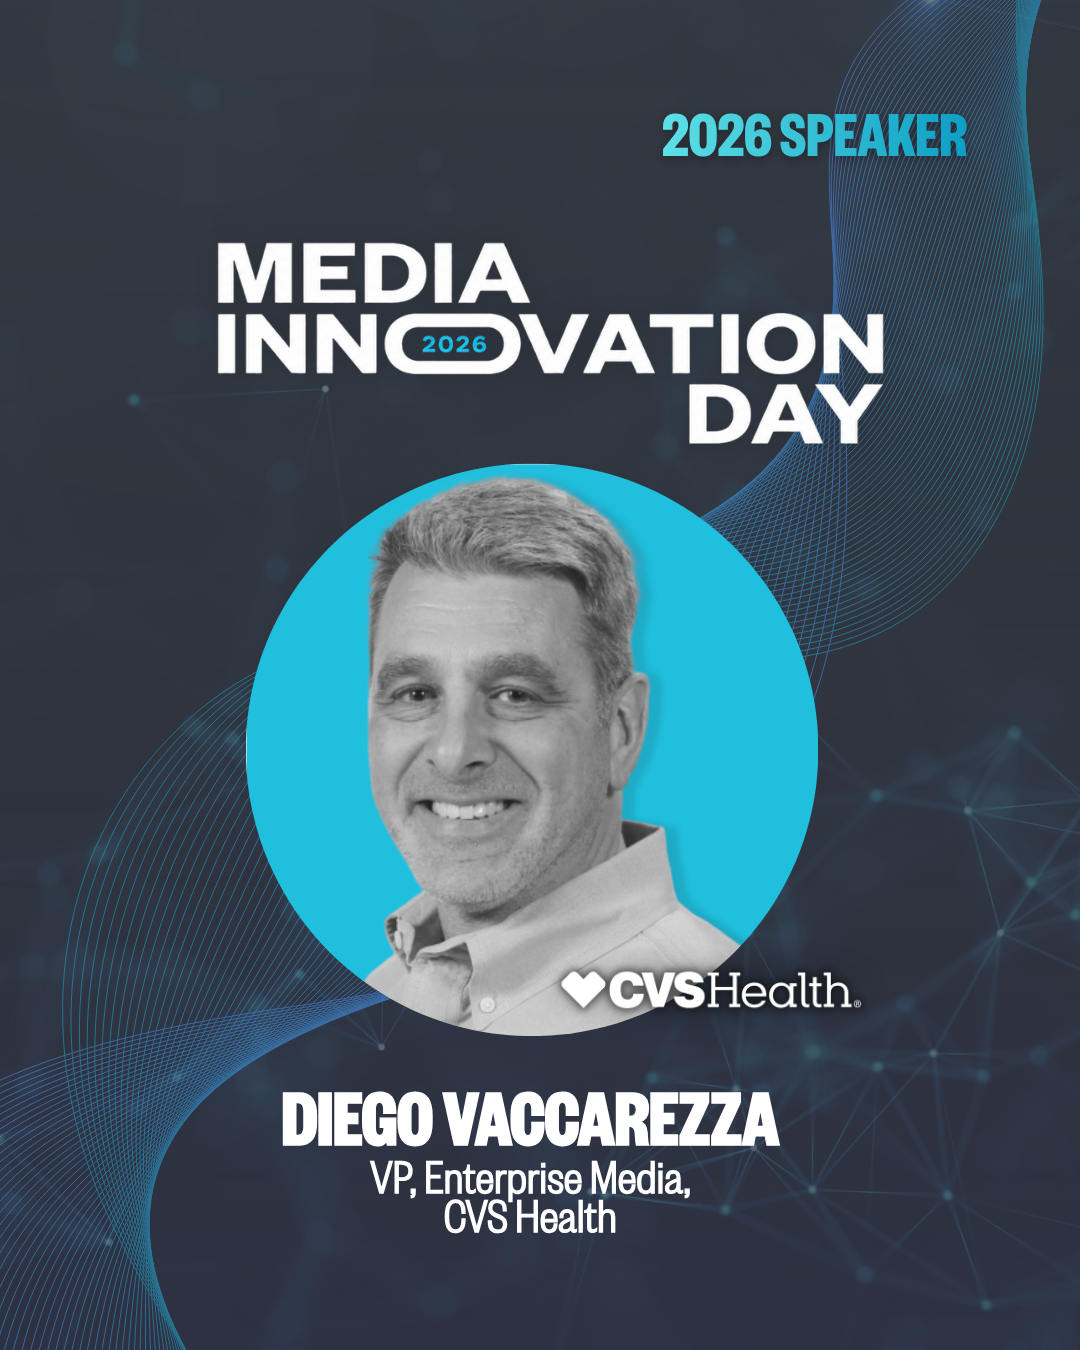
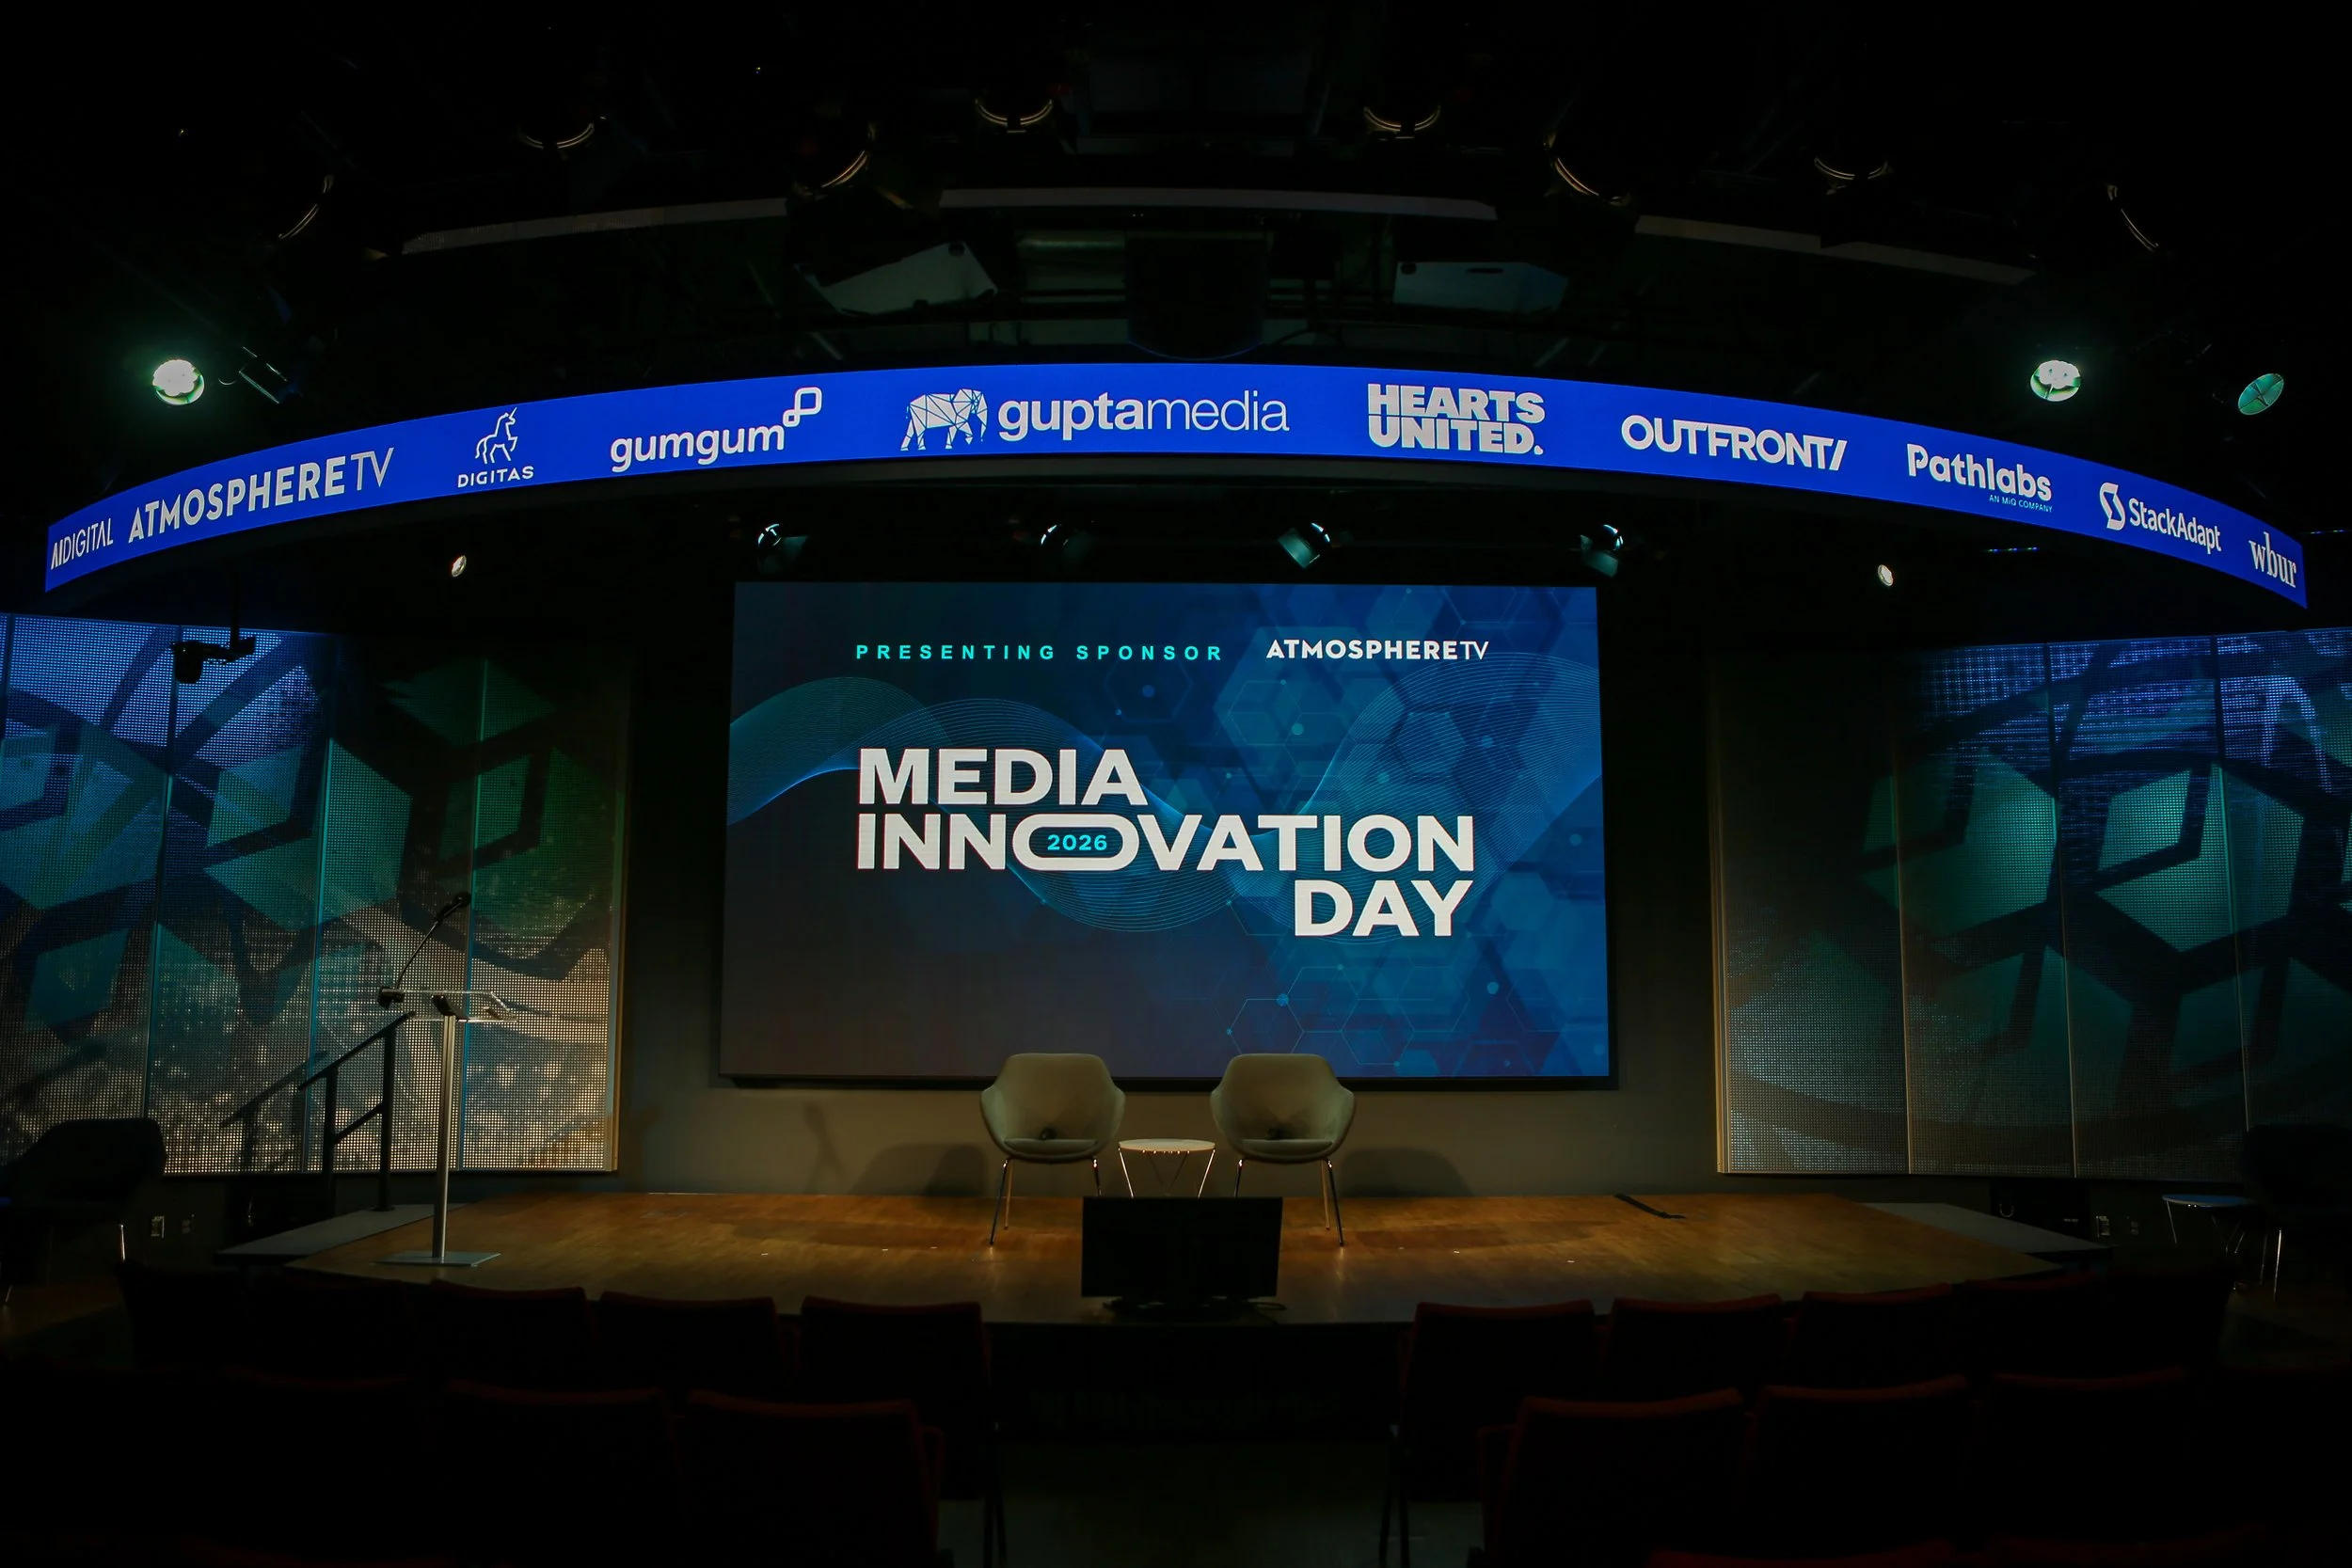
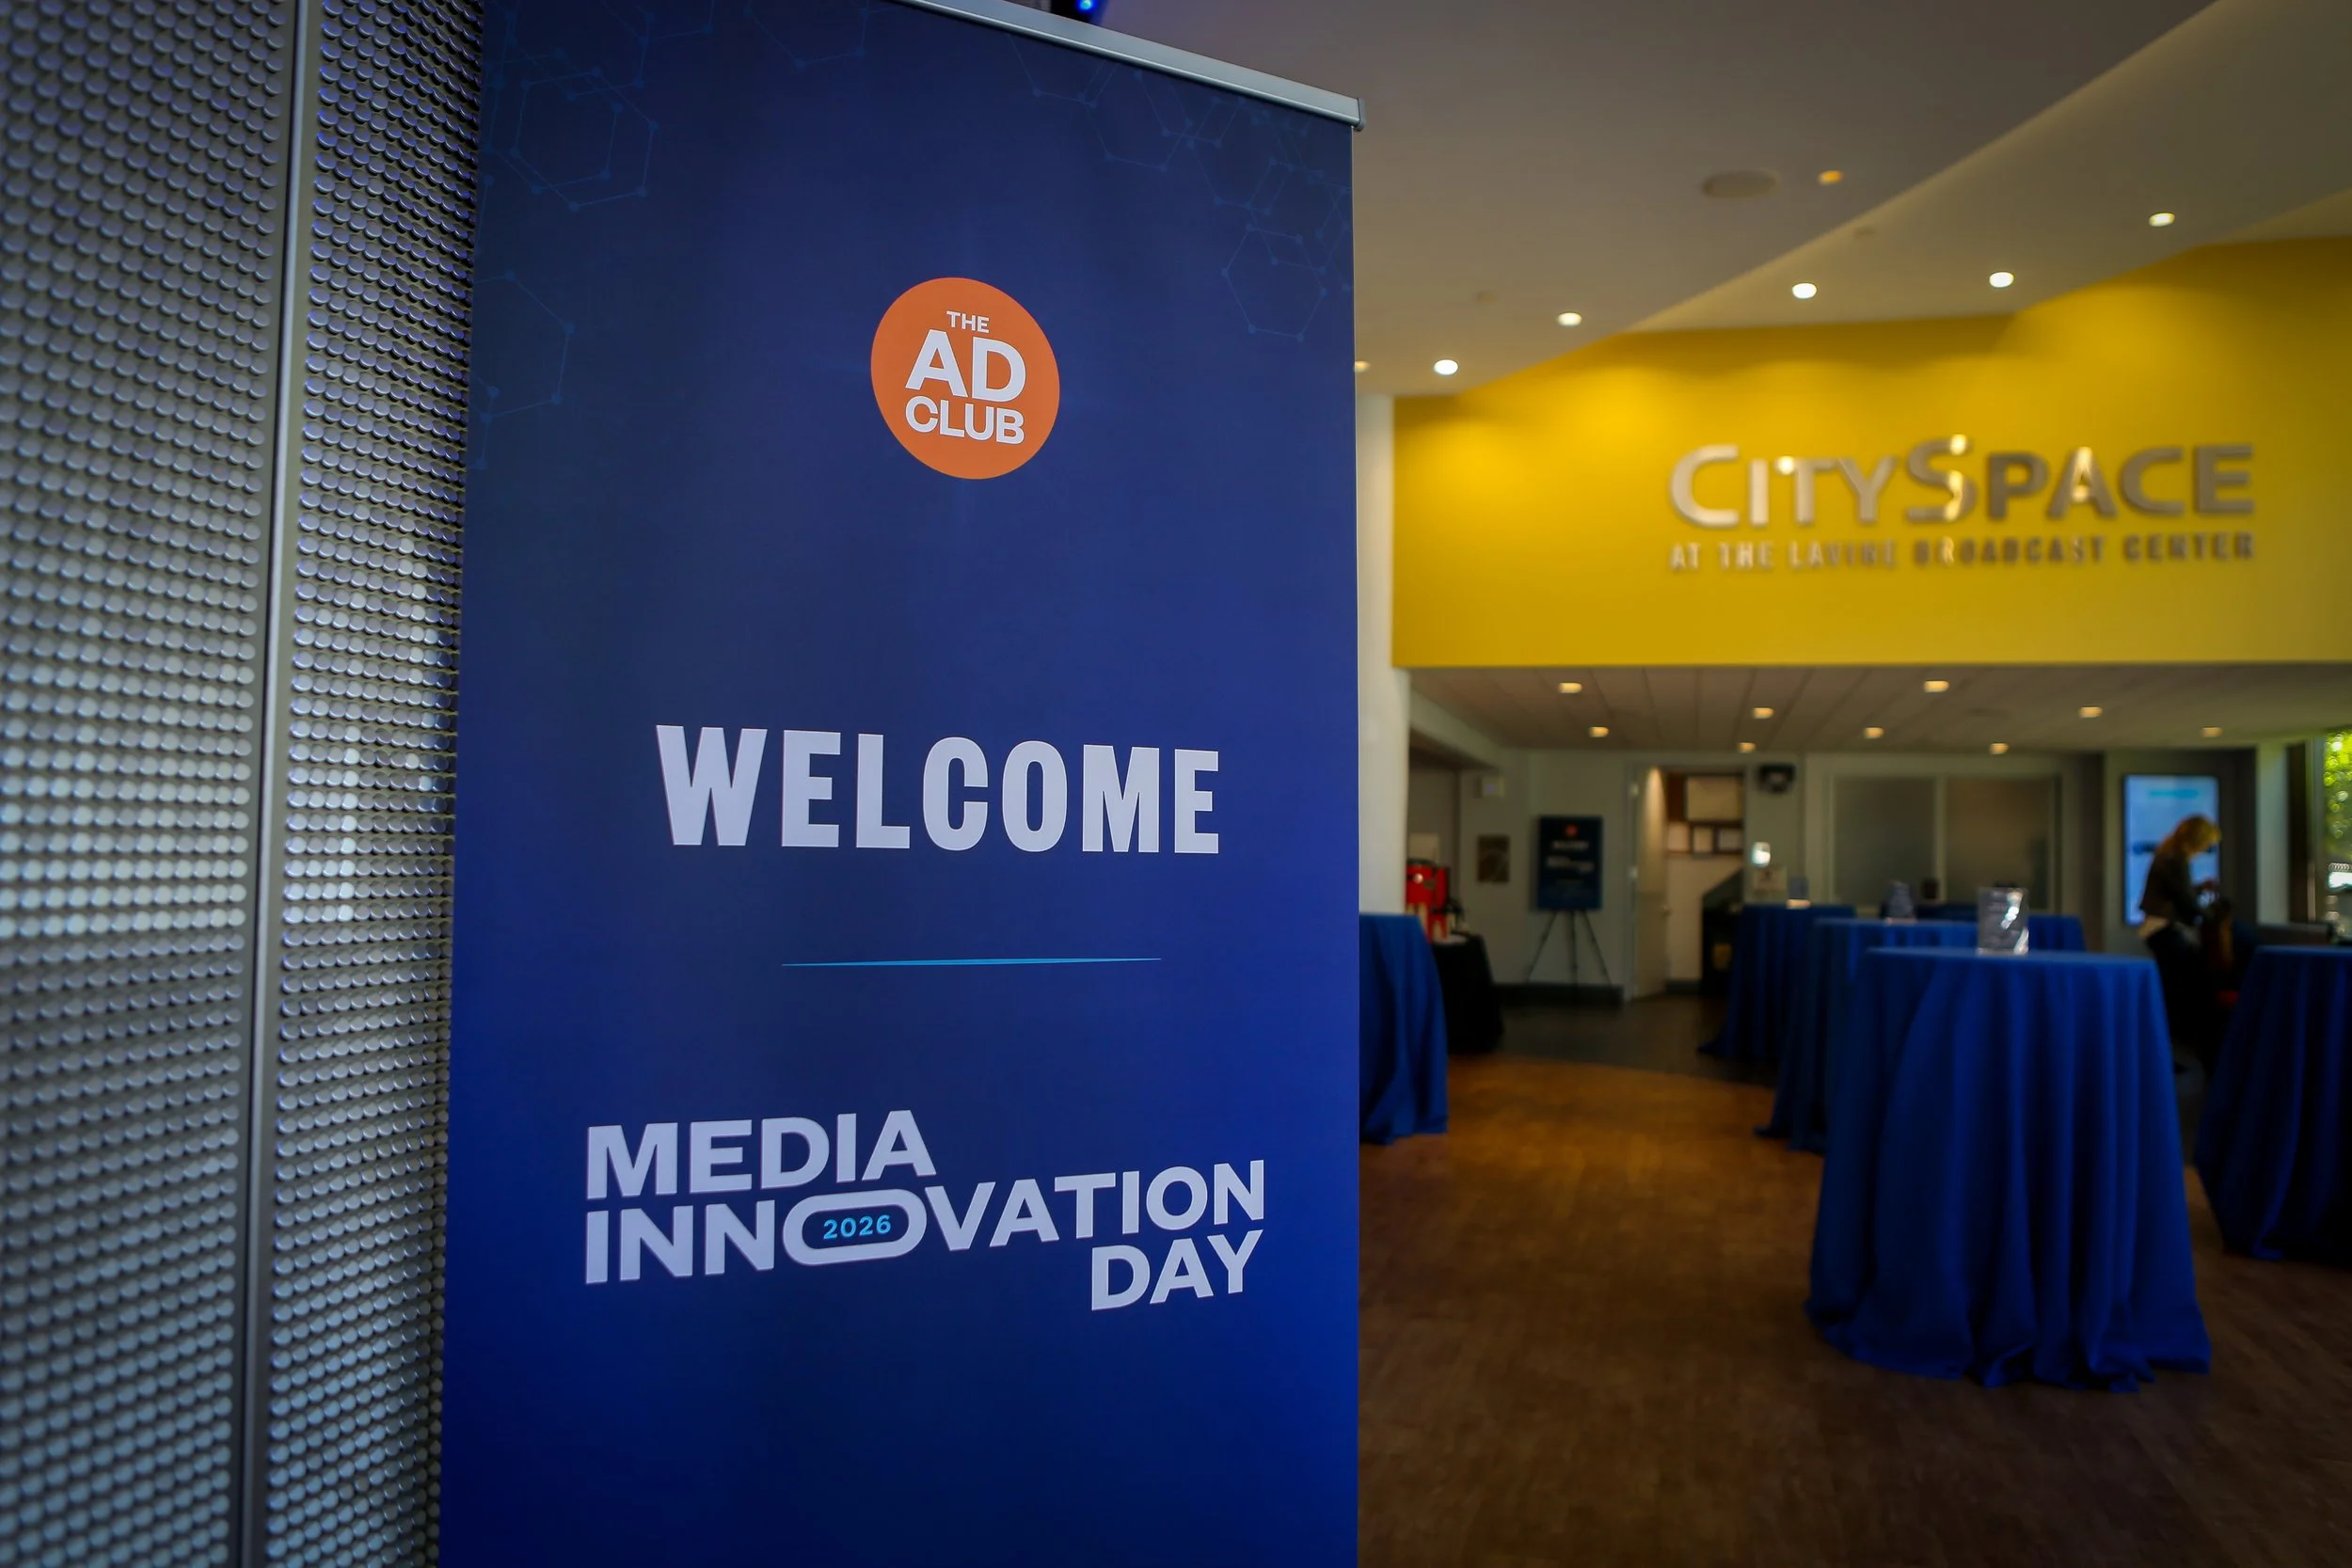
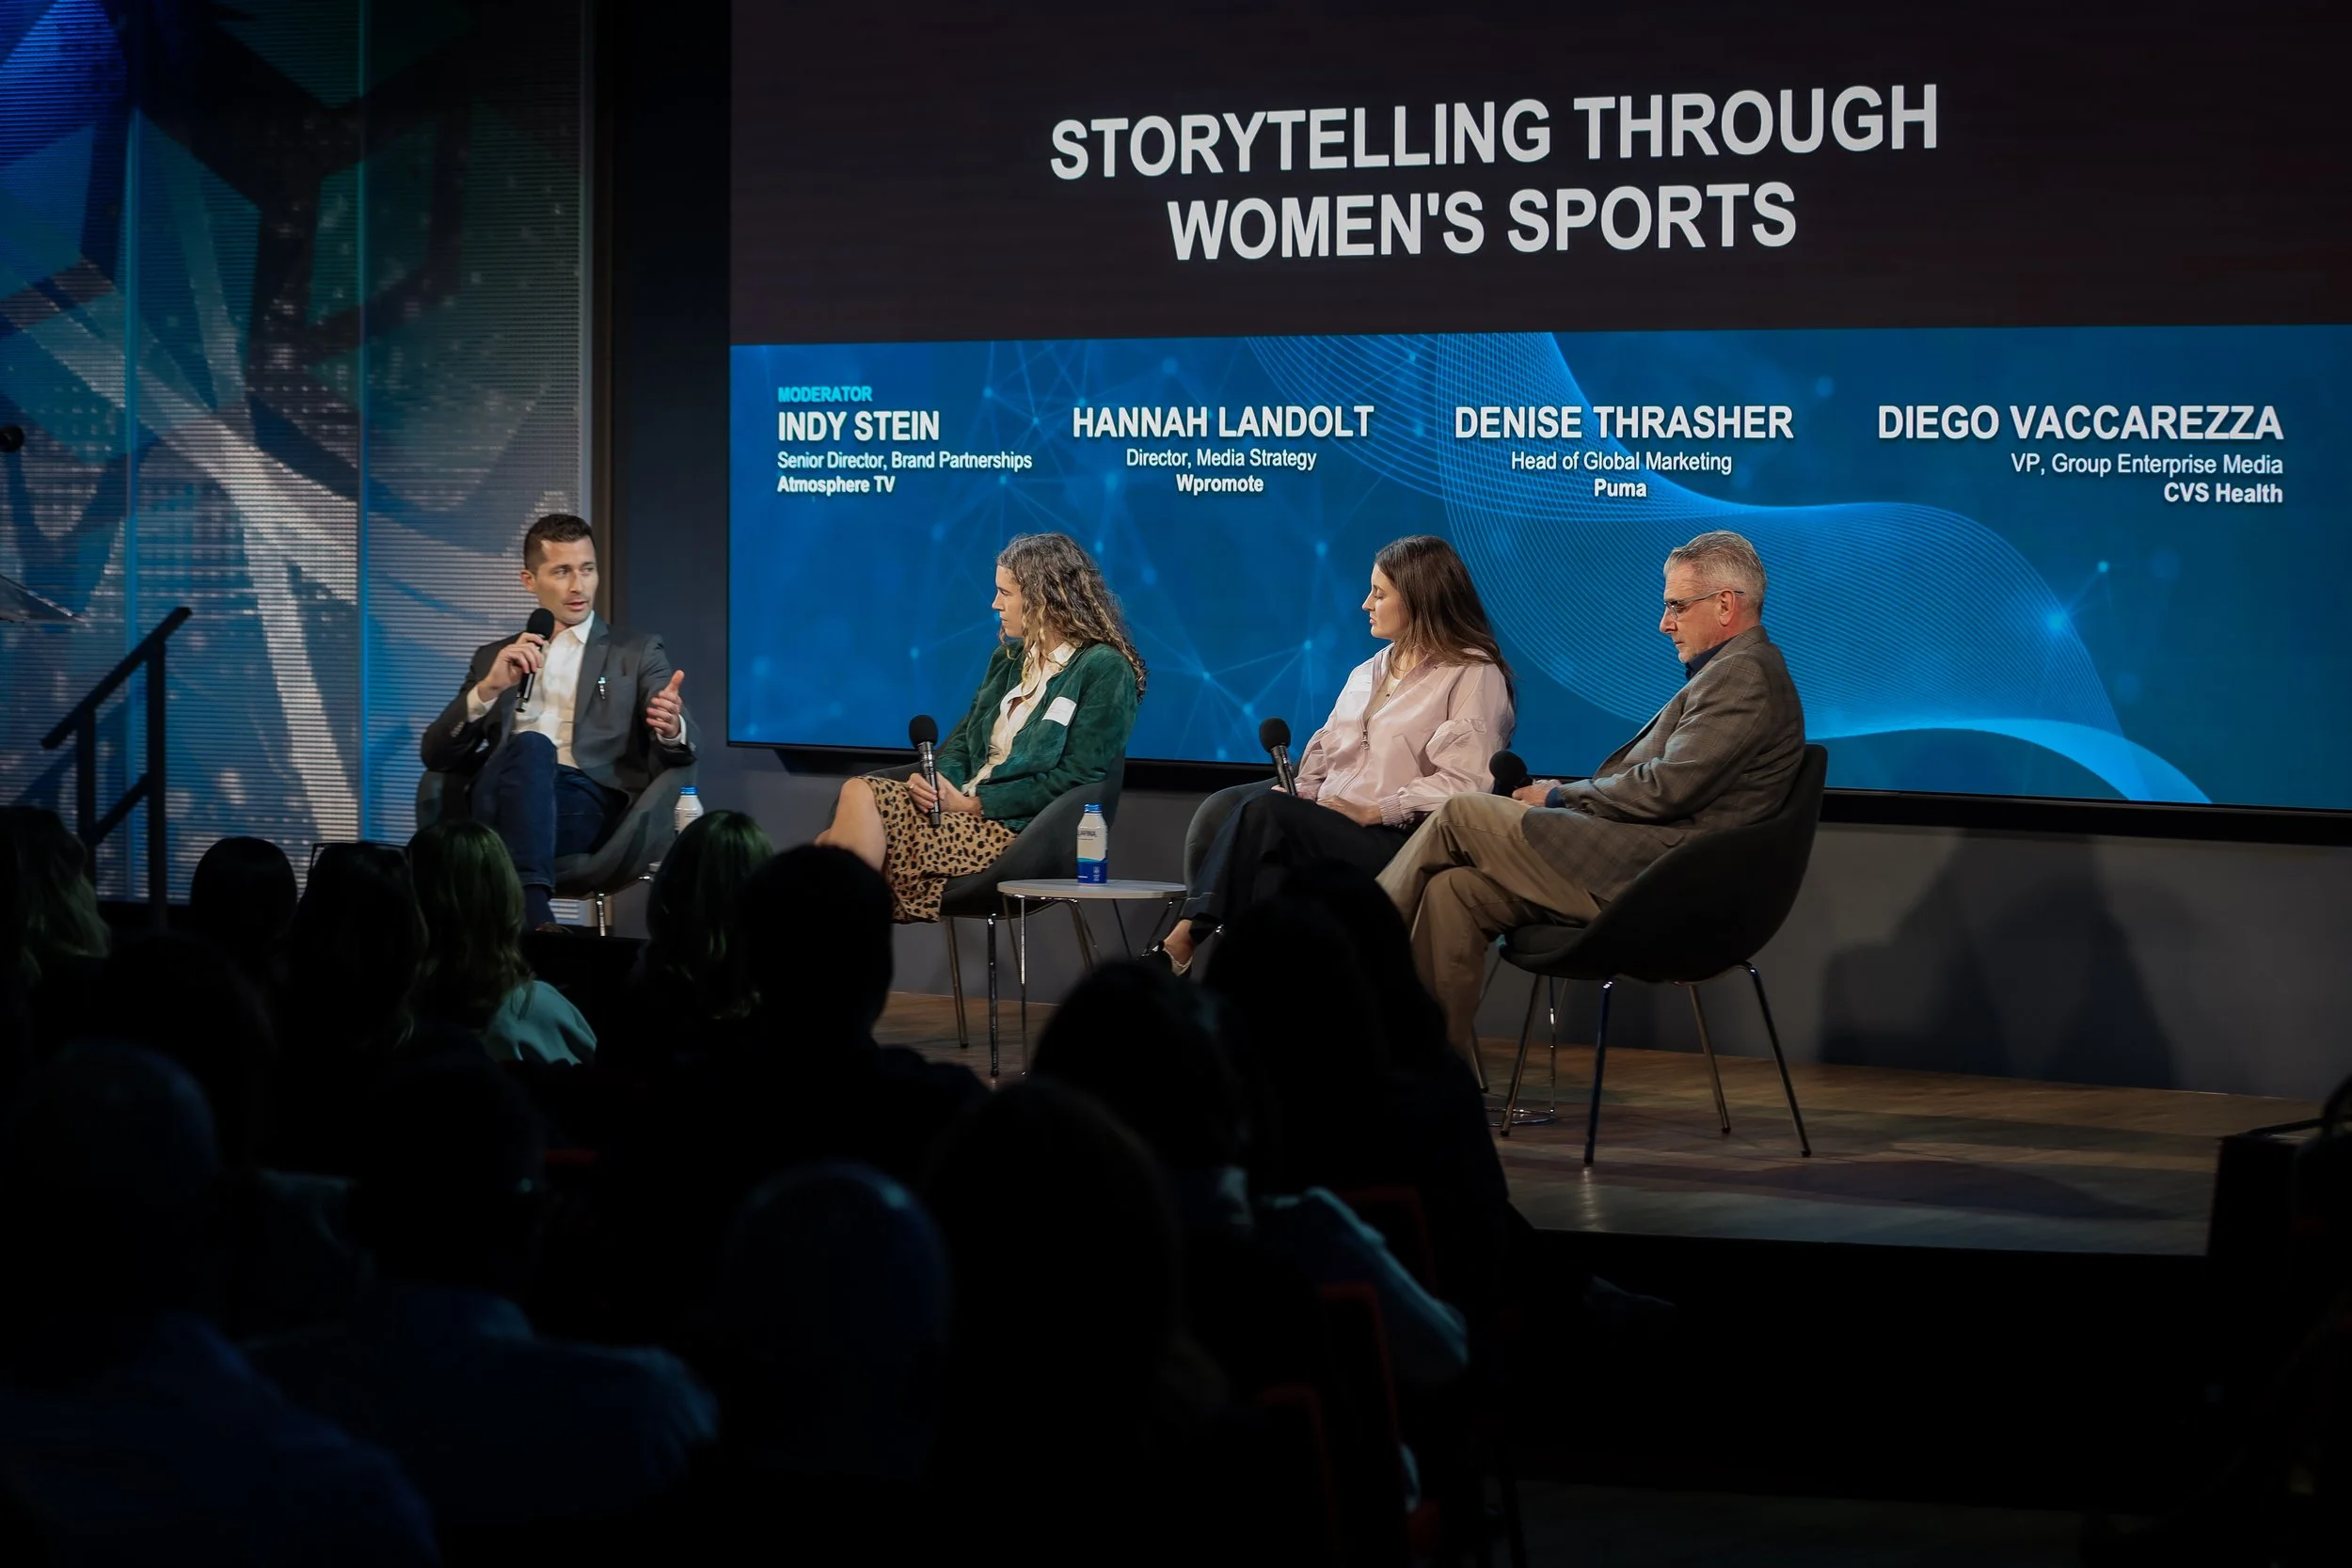
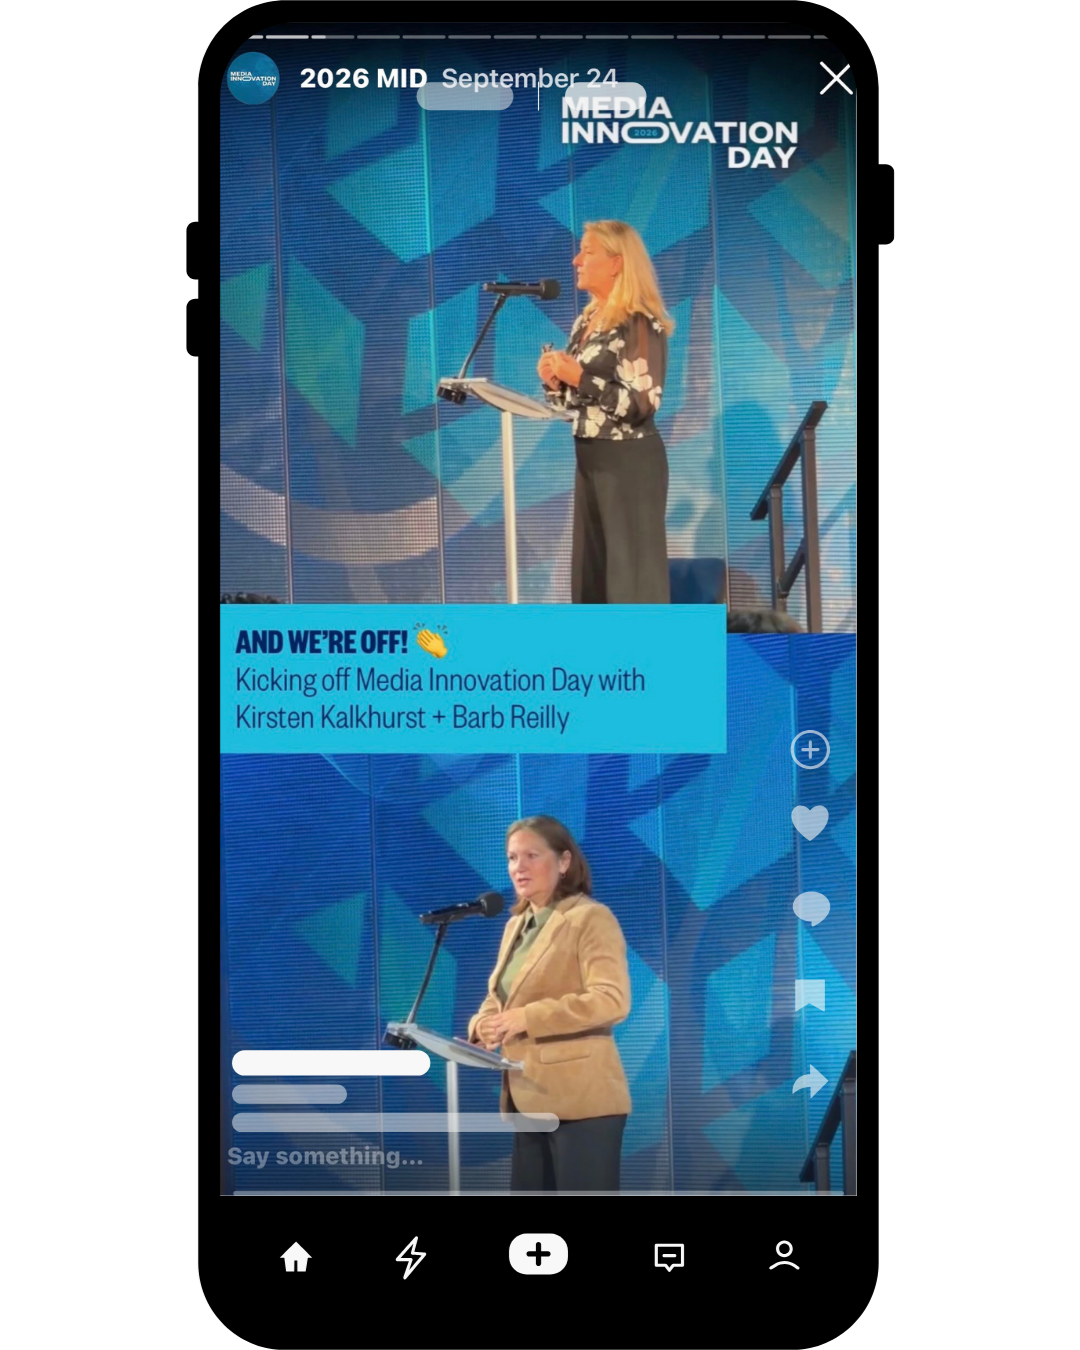
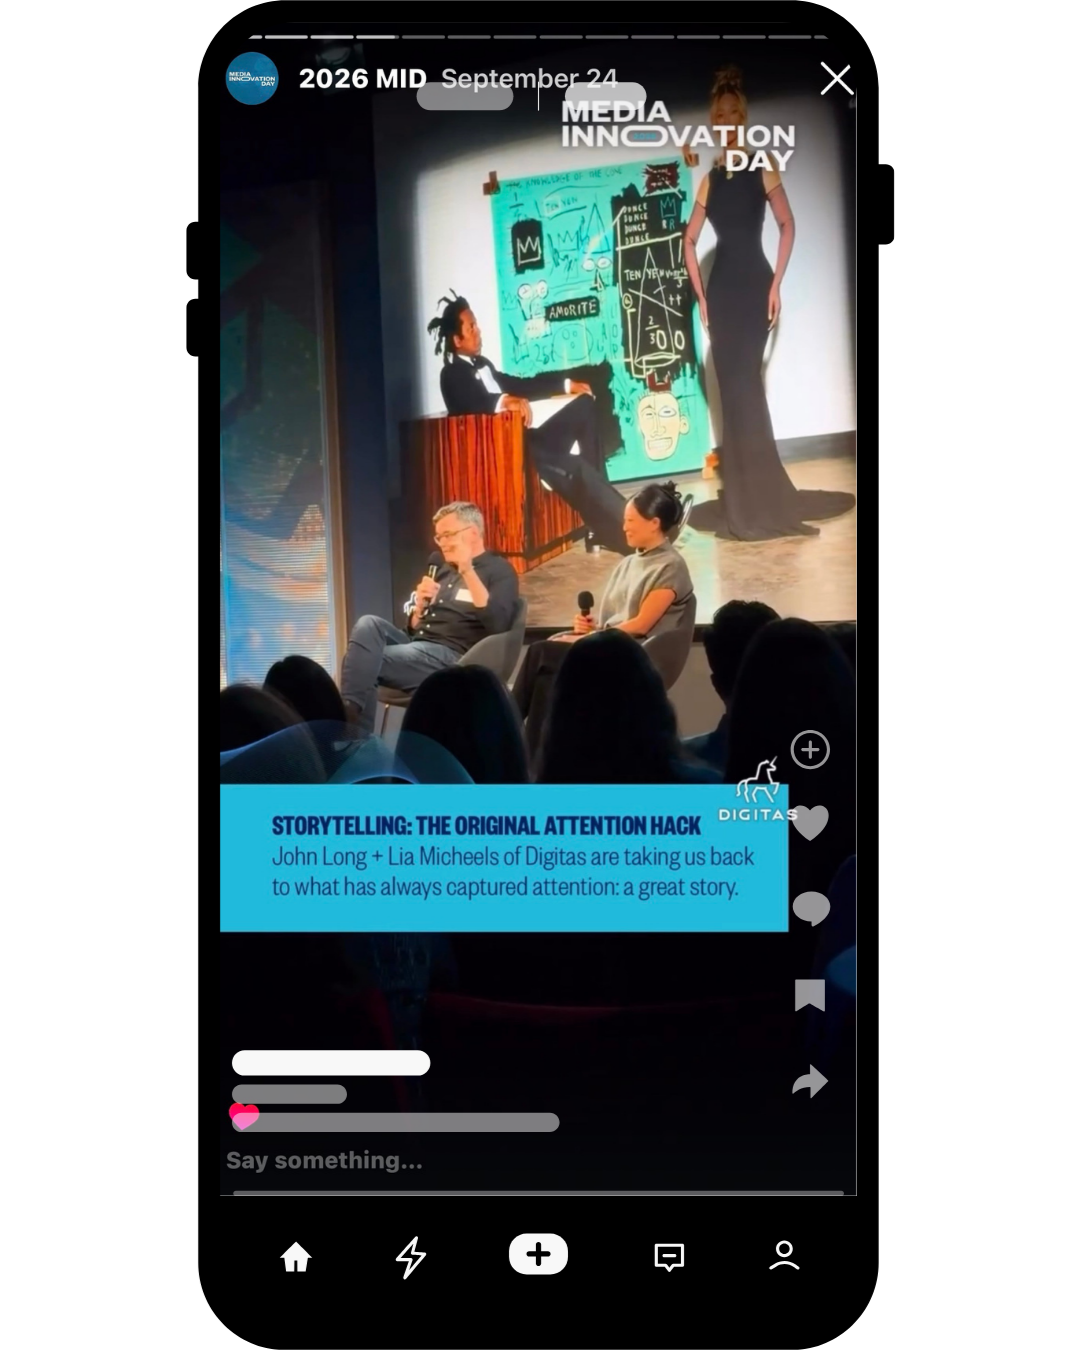
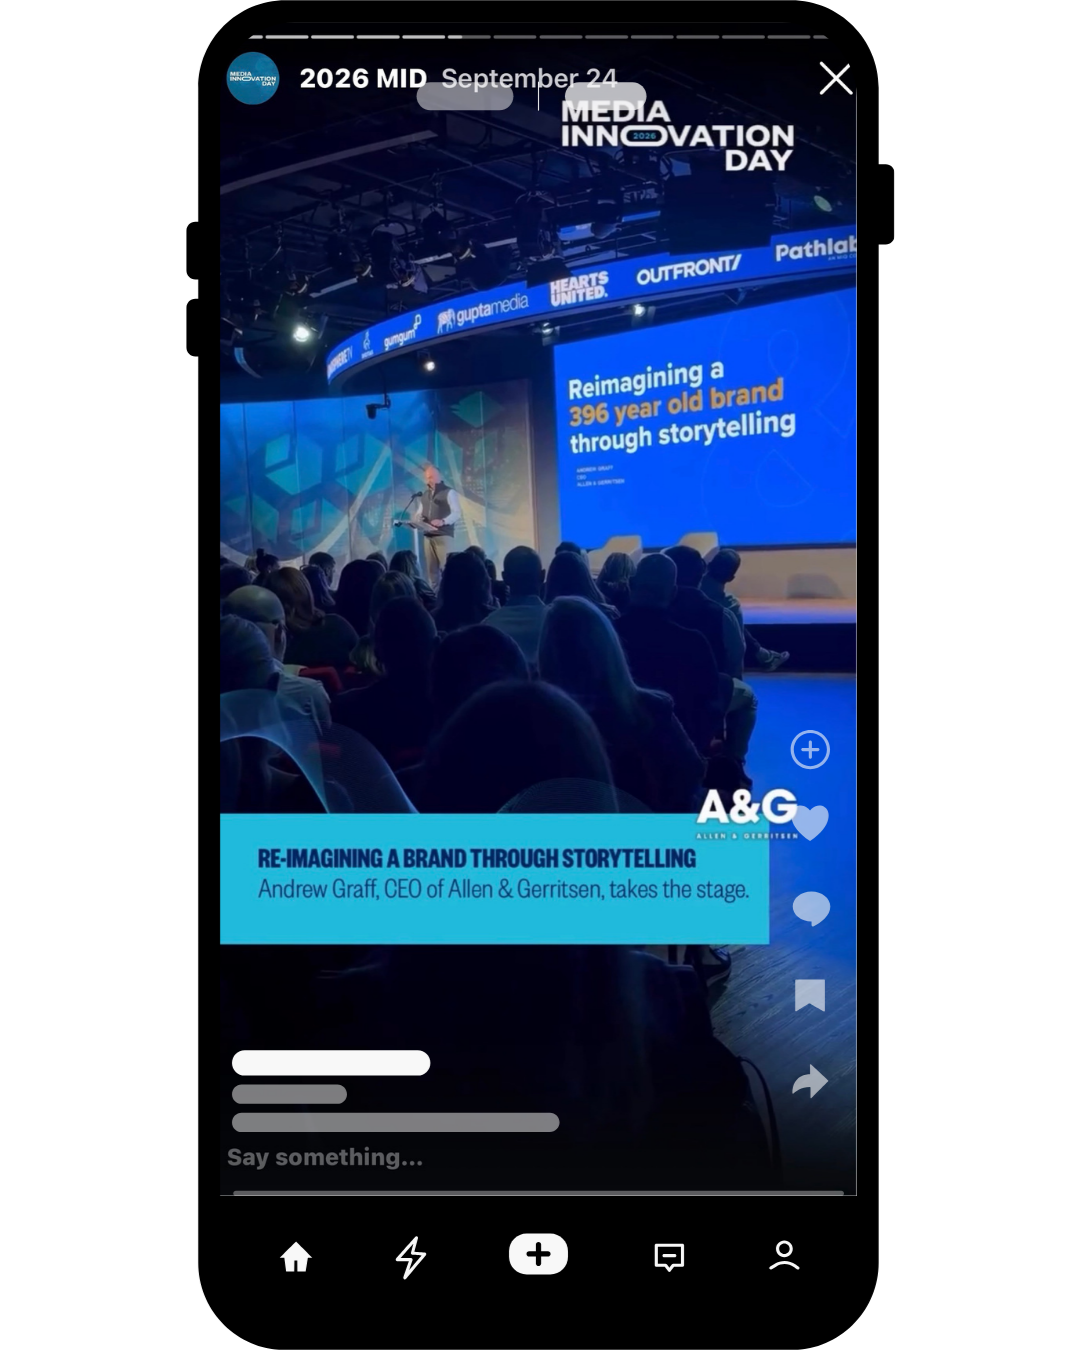
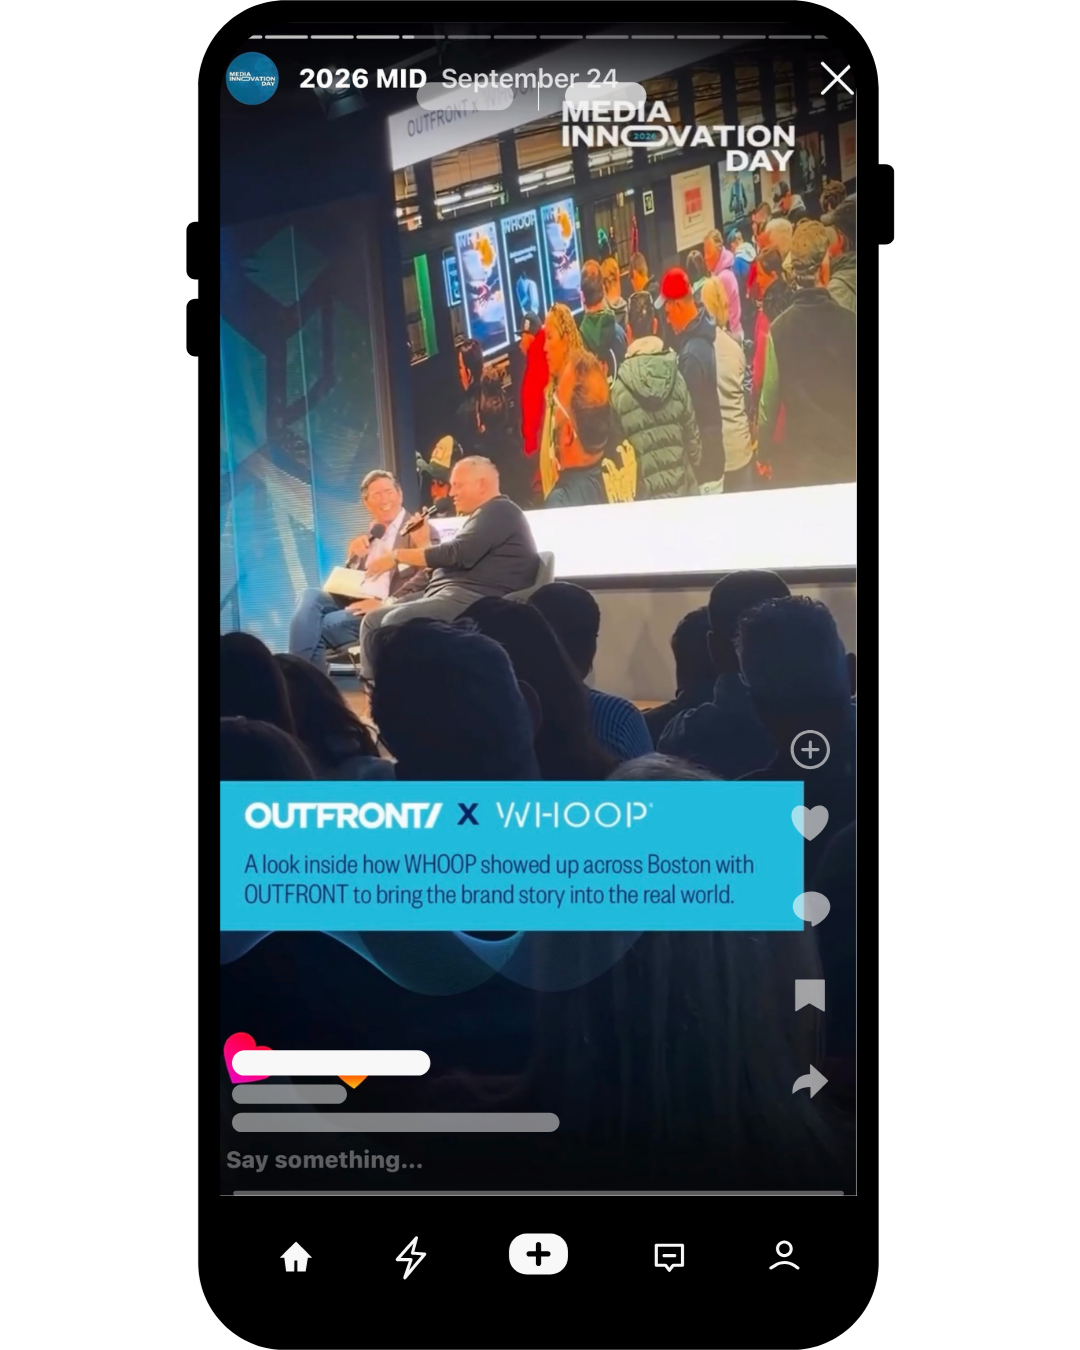
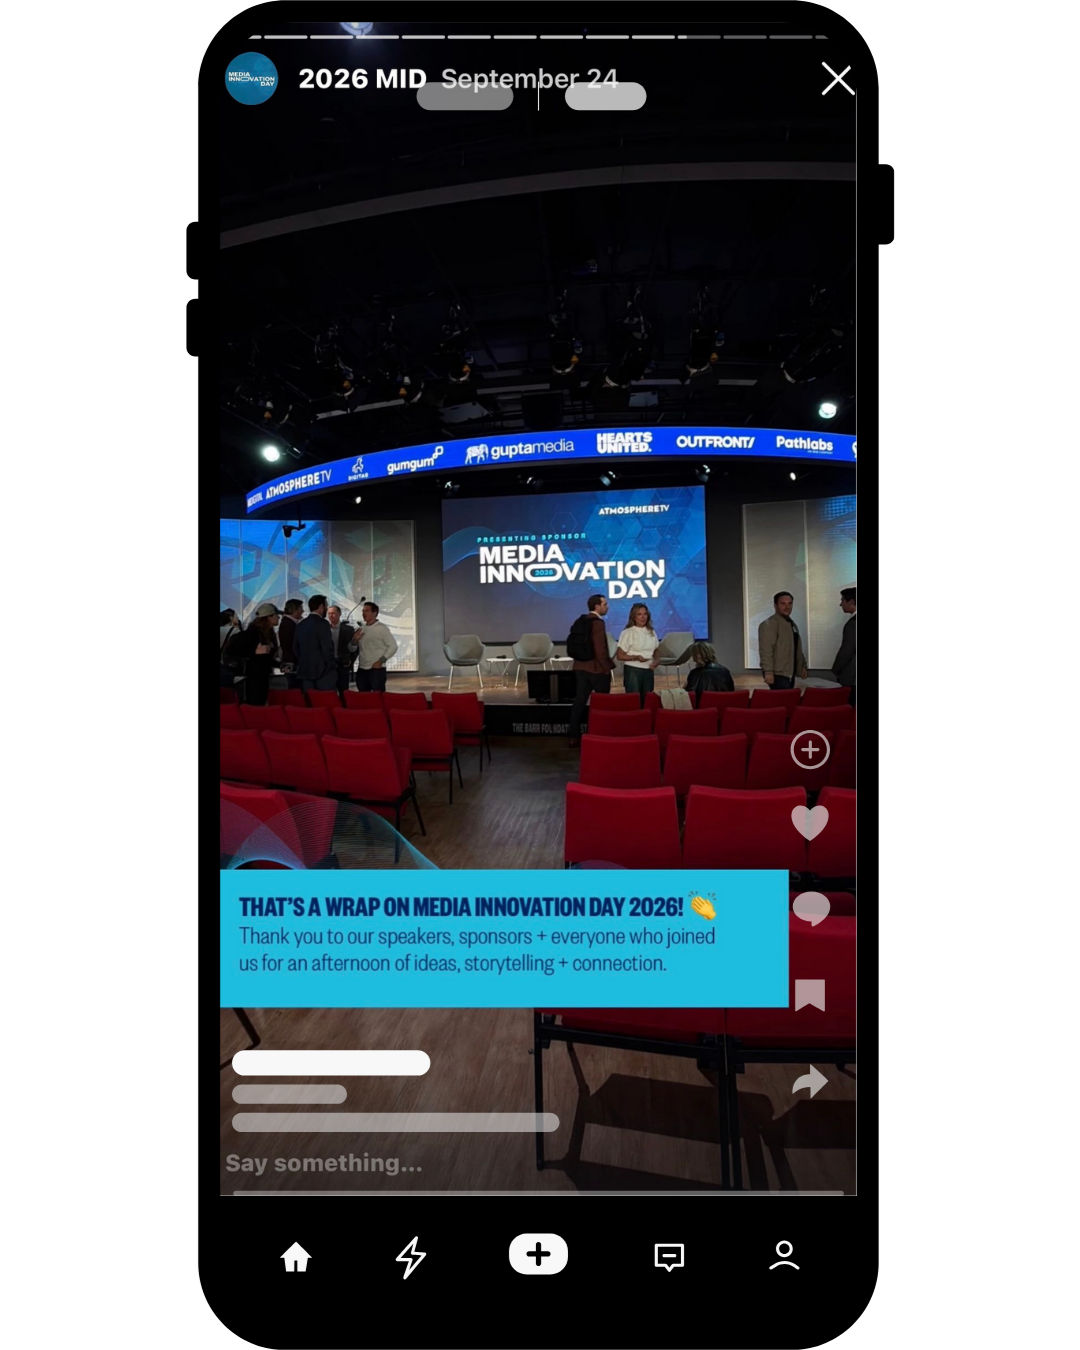
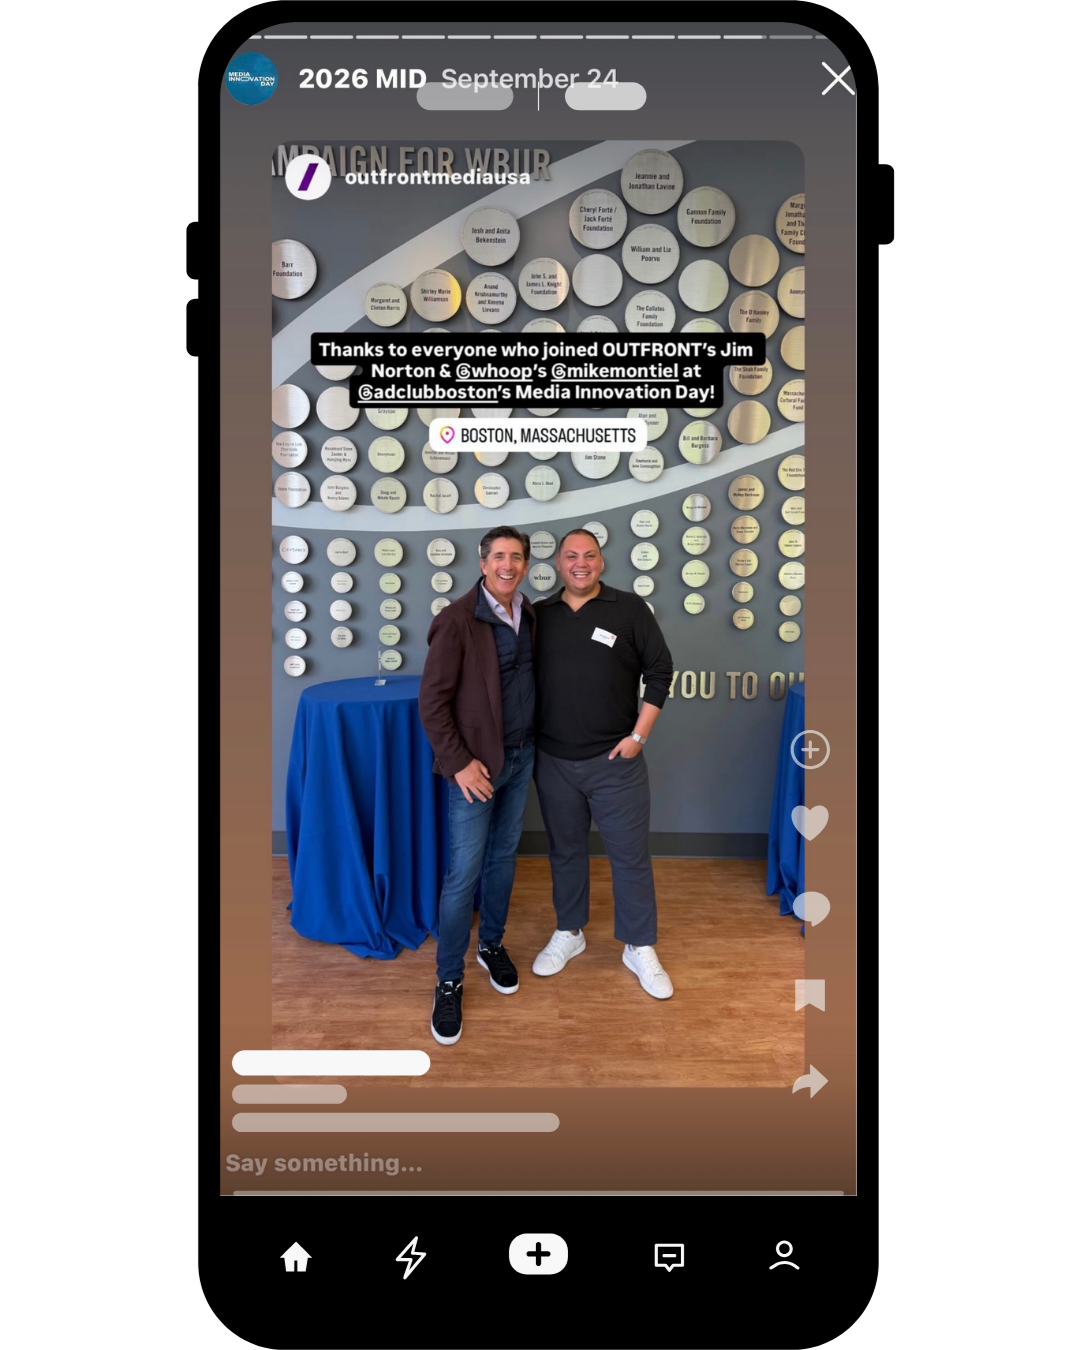
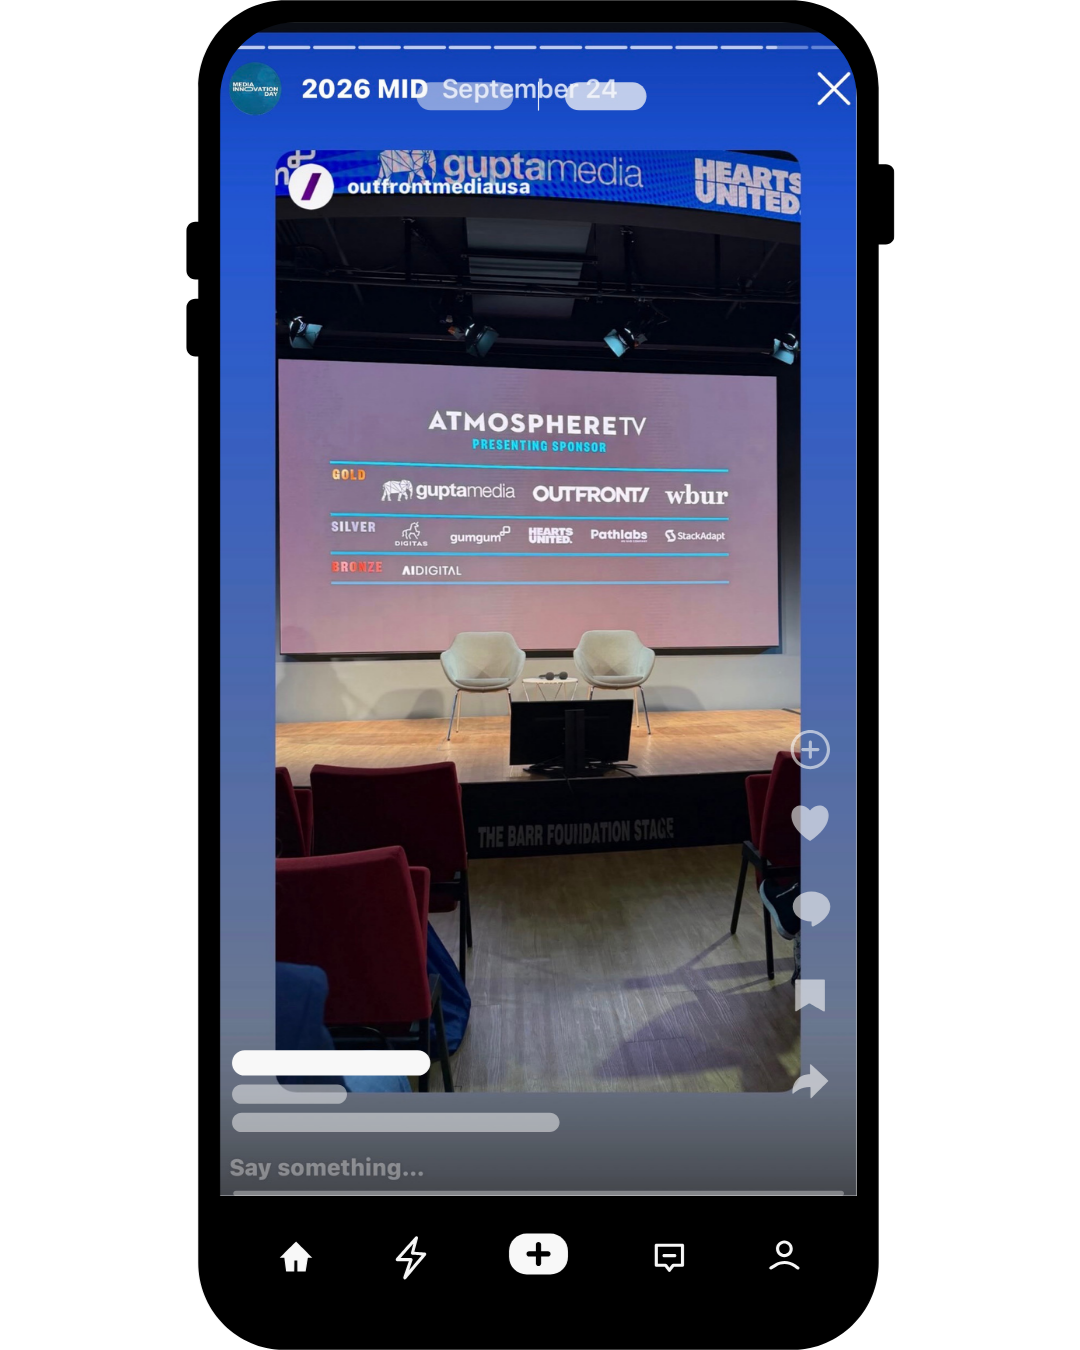
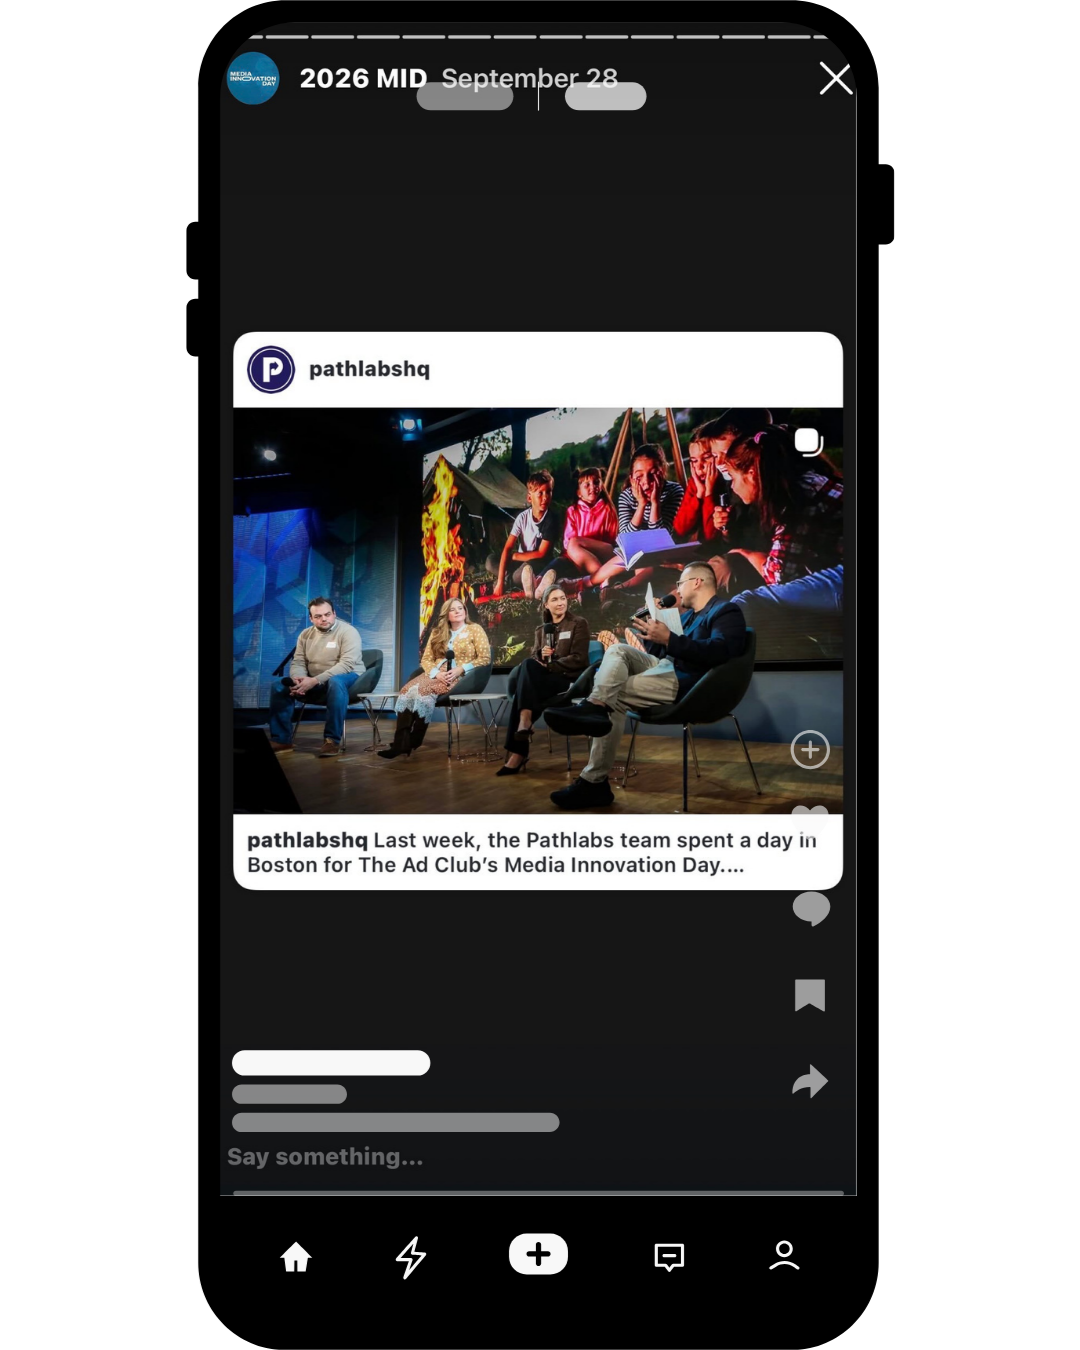
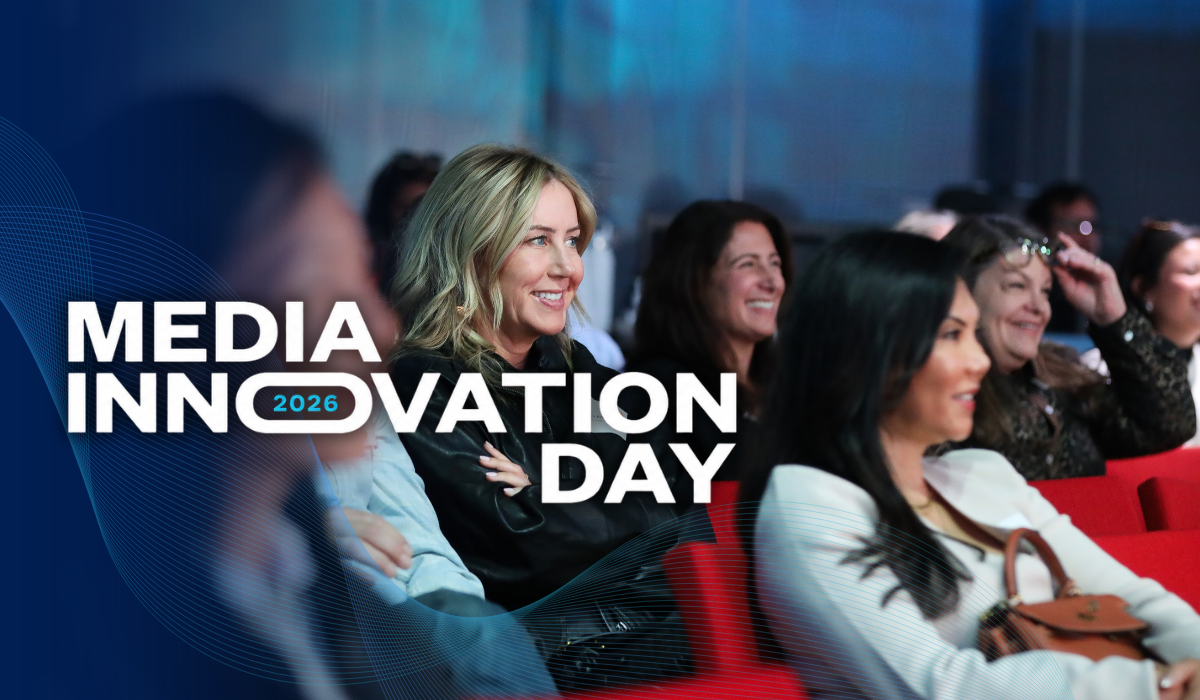
The Ad Club’s 2026 Media Innovation Day brought 236 attendees to WBUR’s CitySpace for conversations about storytelling, creativity, and media effectiveness, featuring speakers from PUMA, CVS Health, and WHOOP.
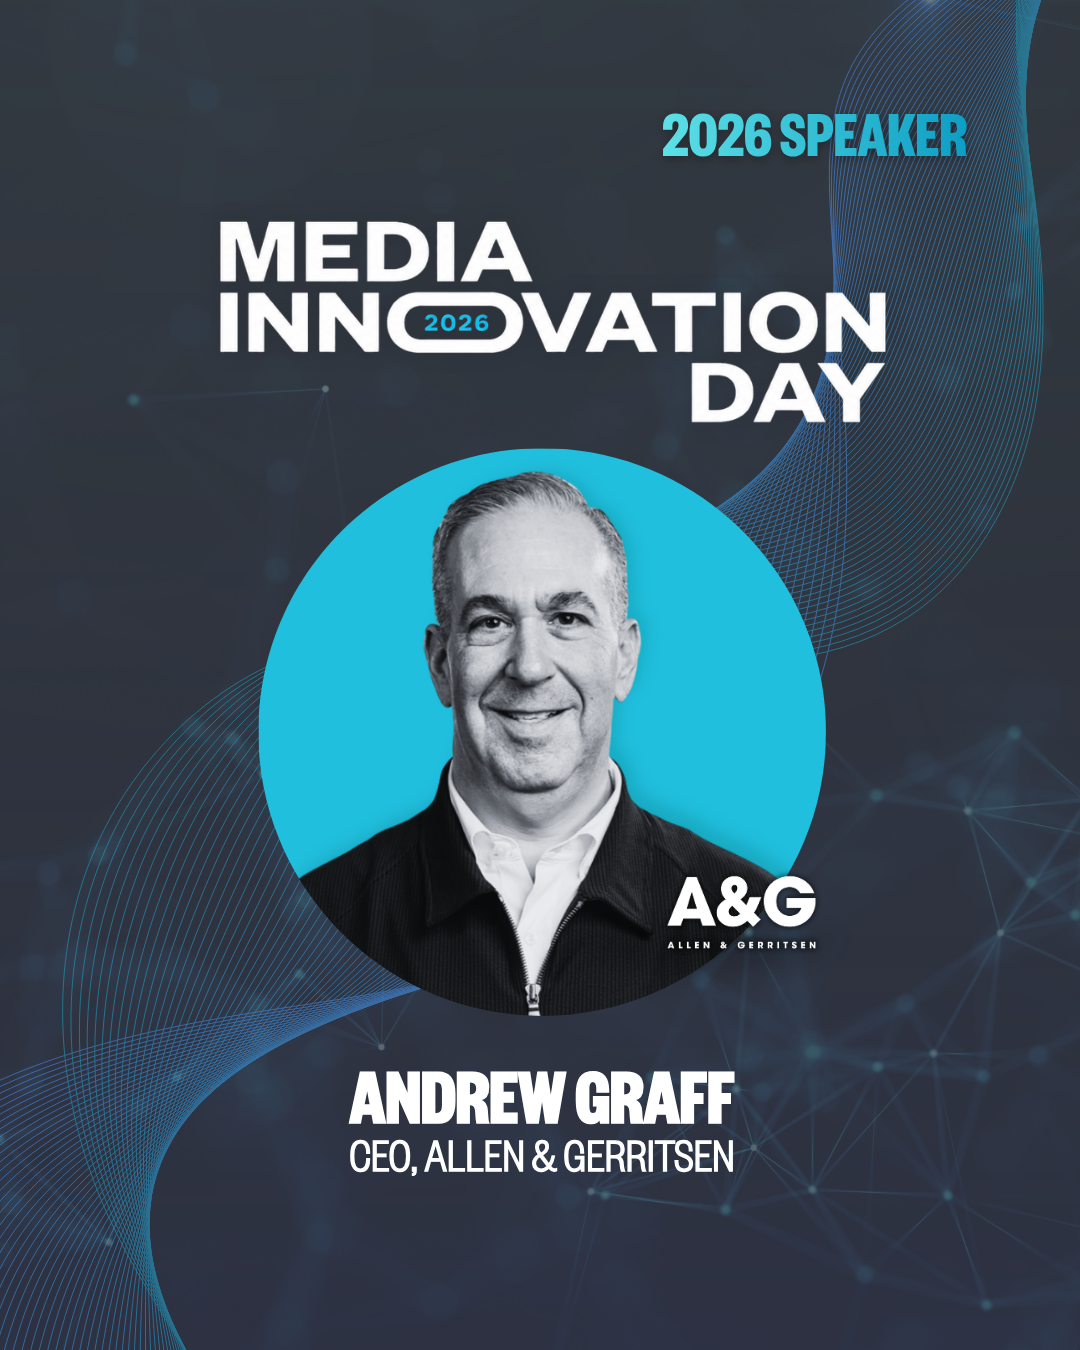
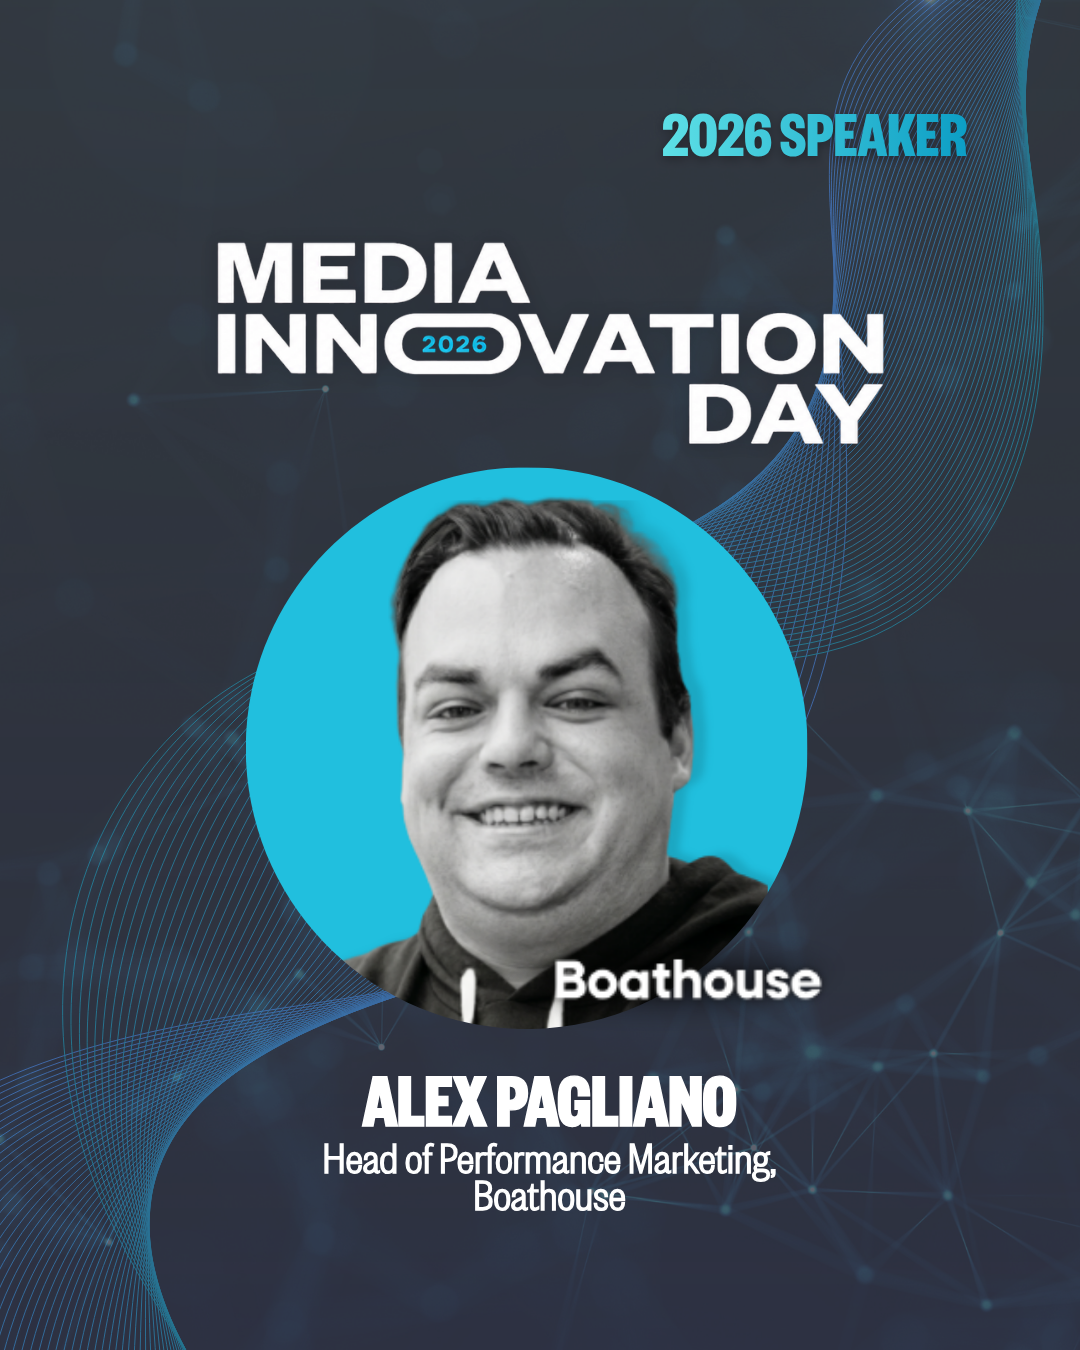
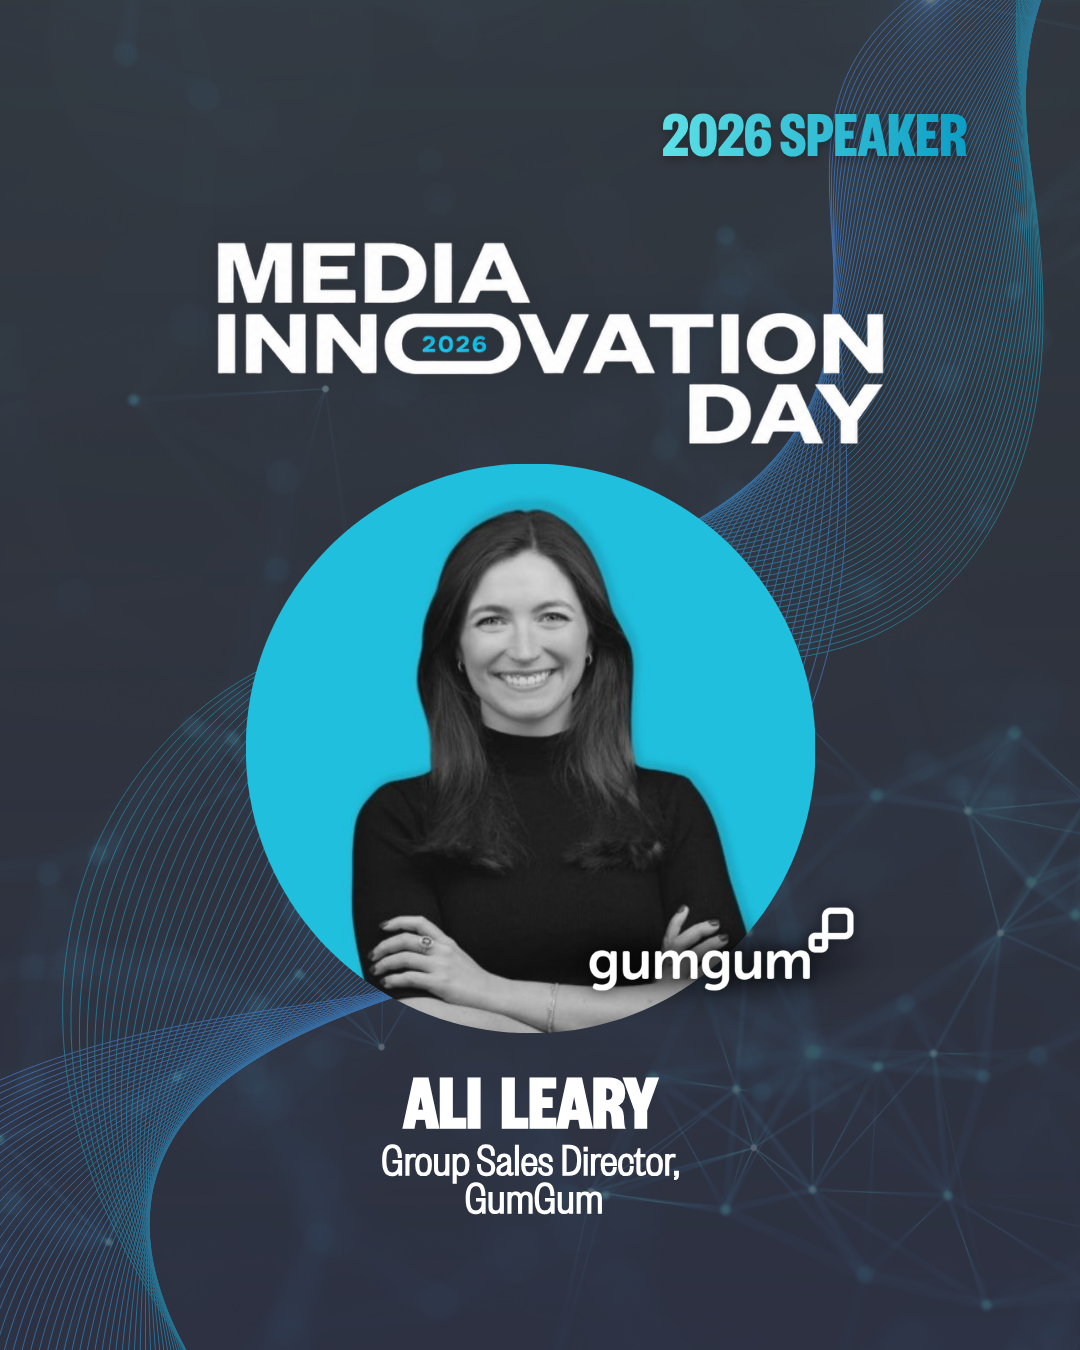
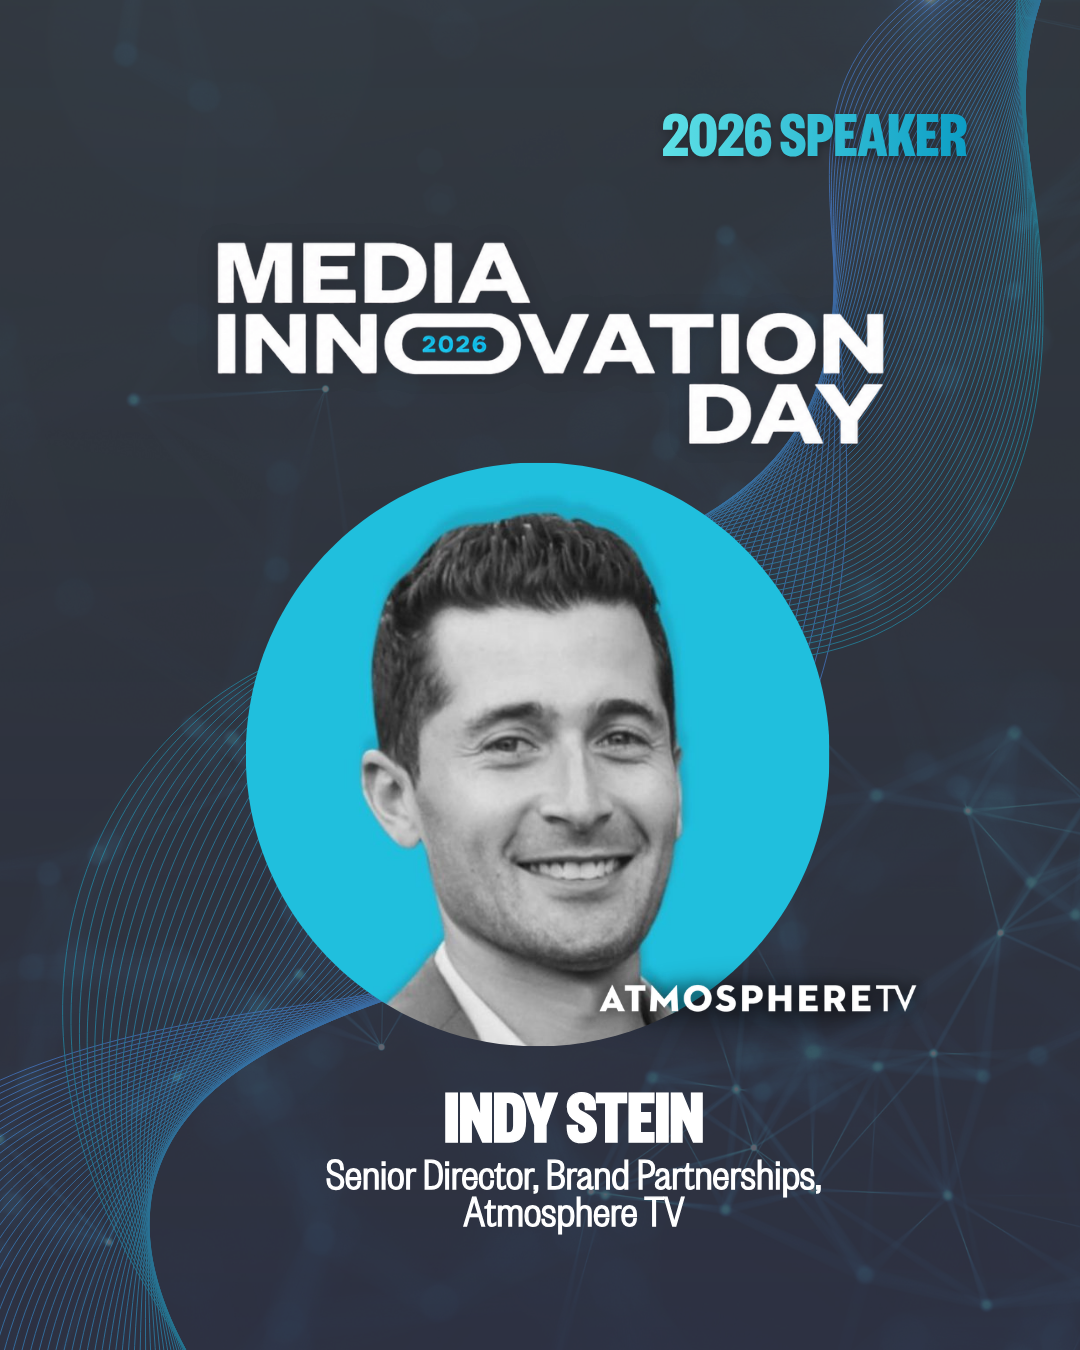
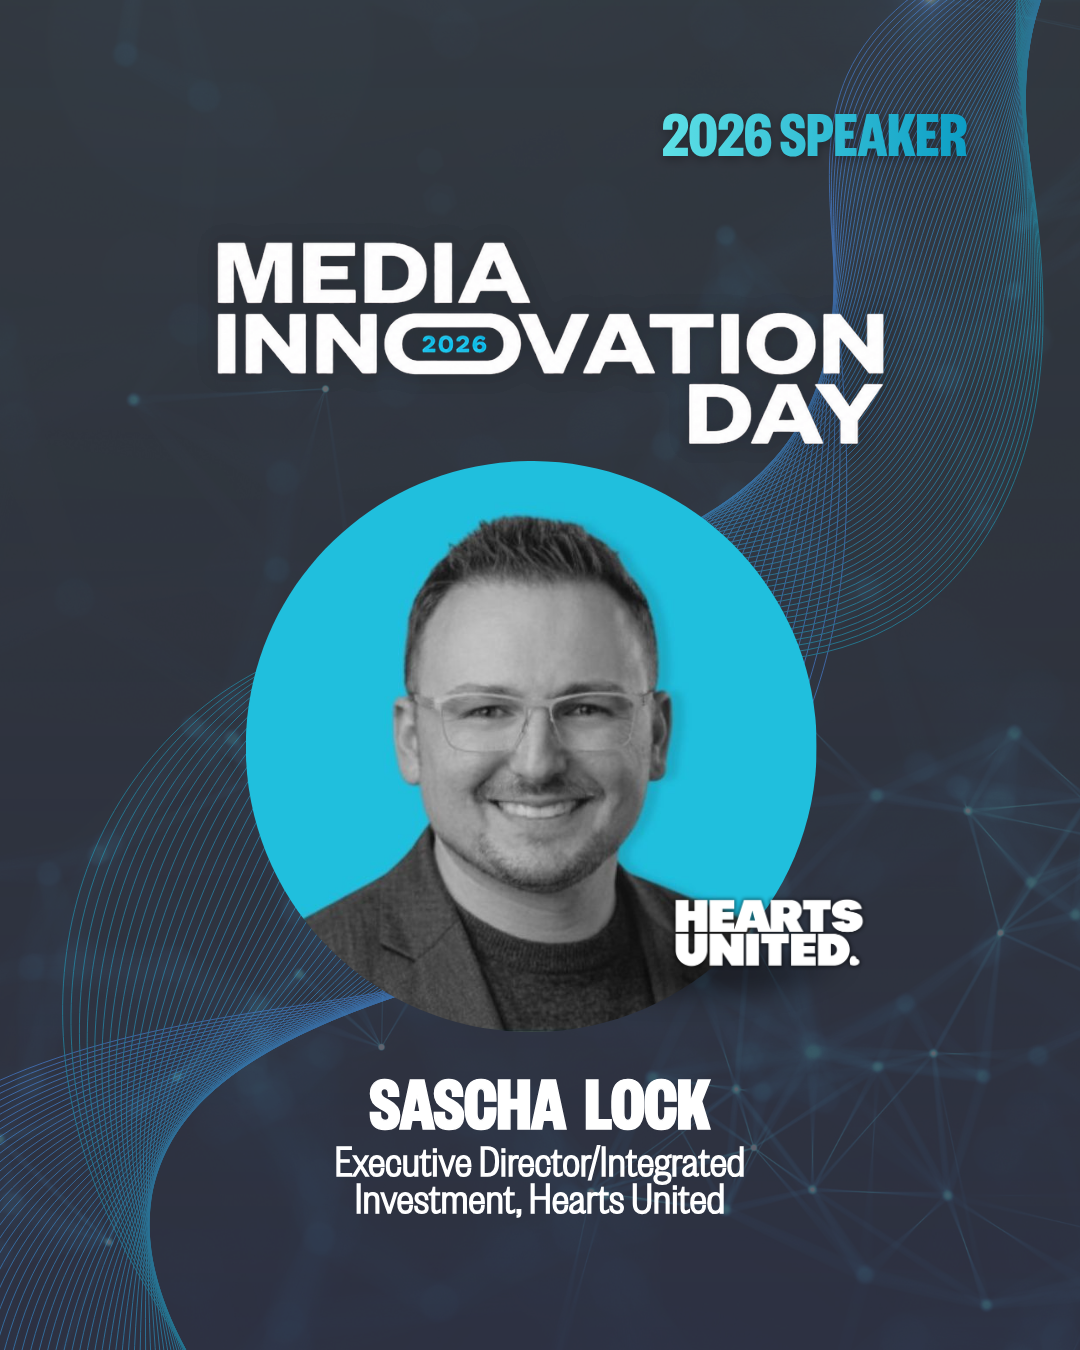
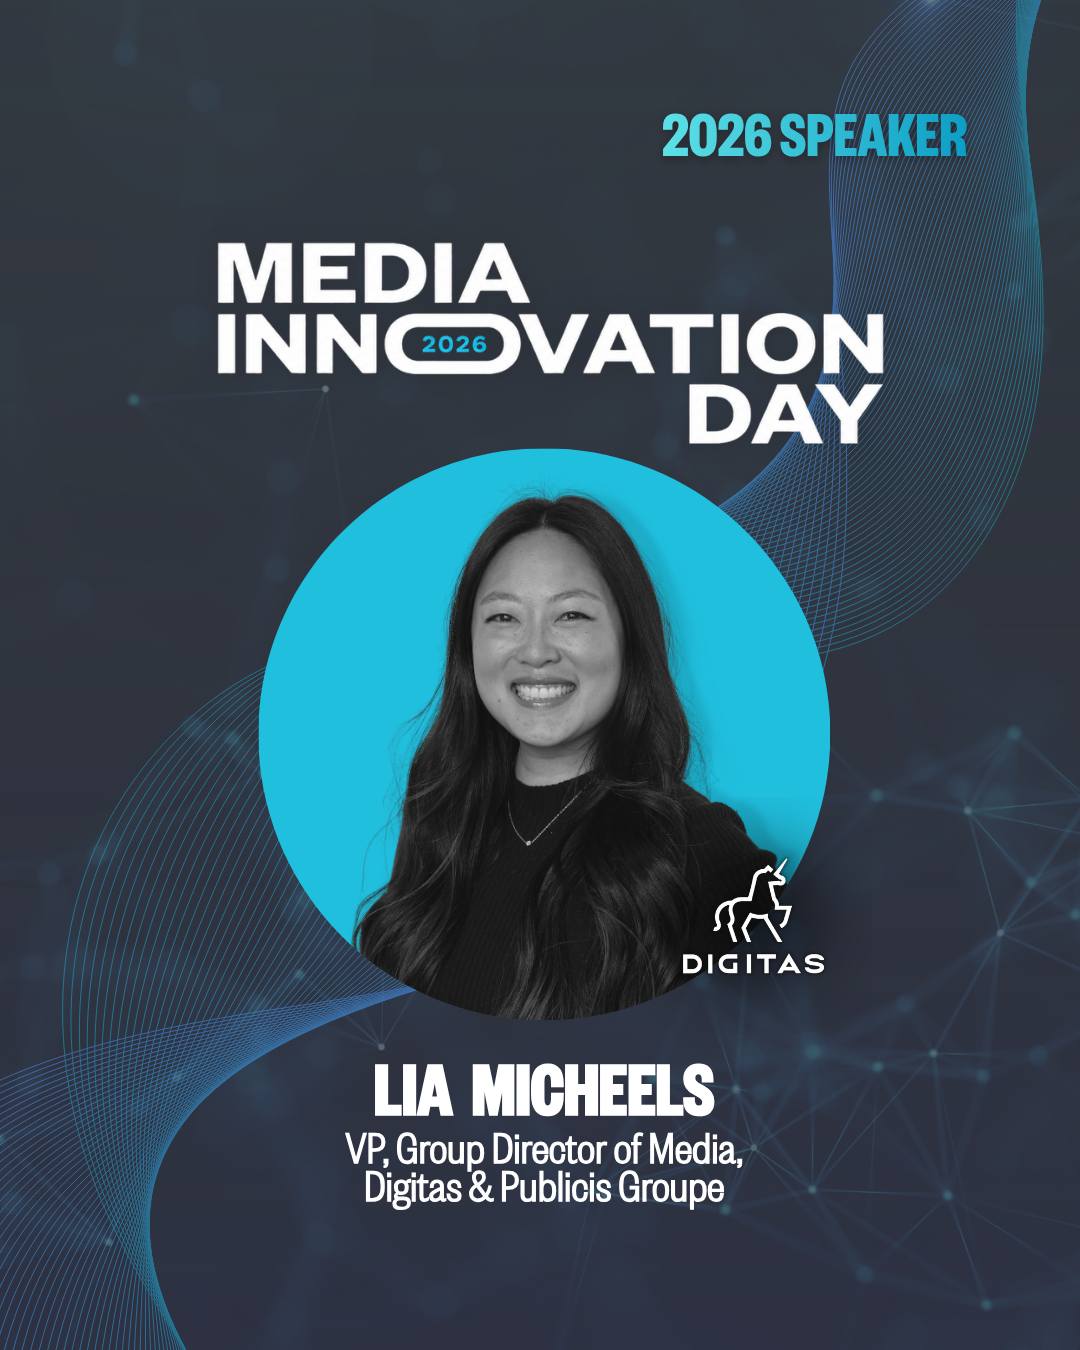
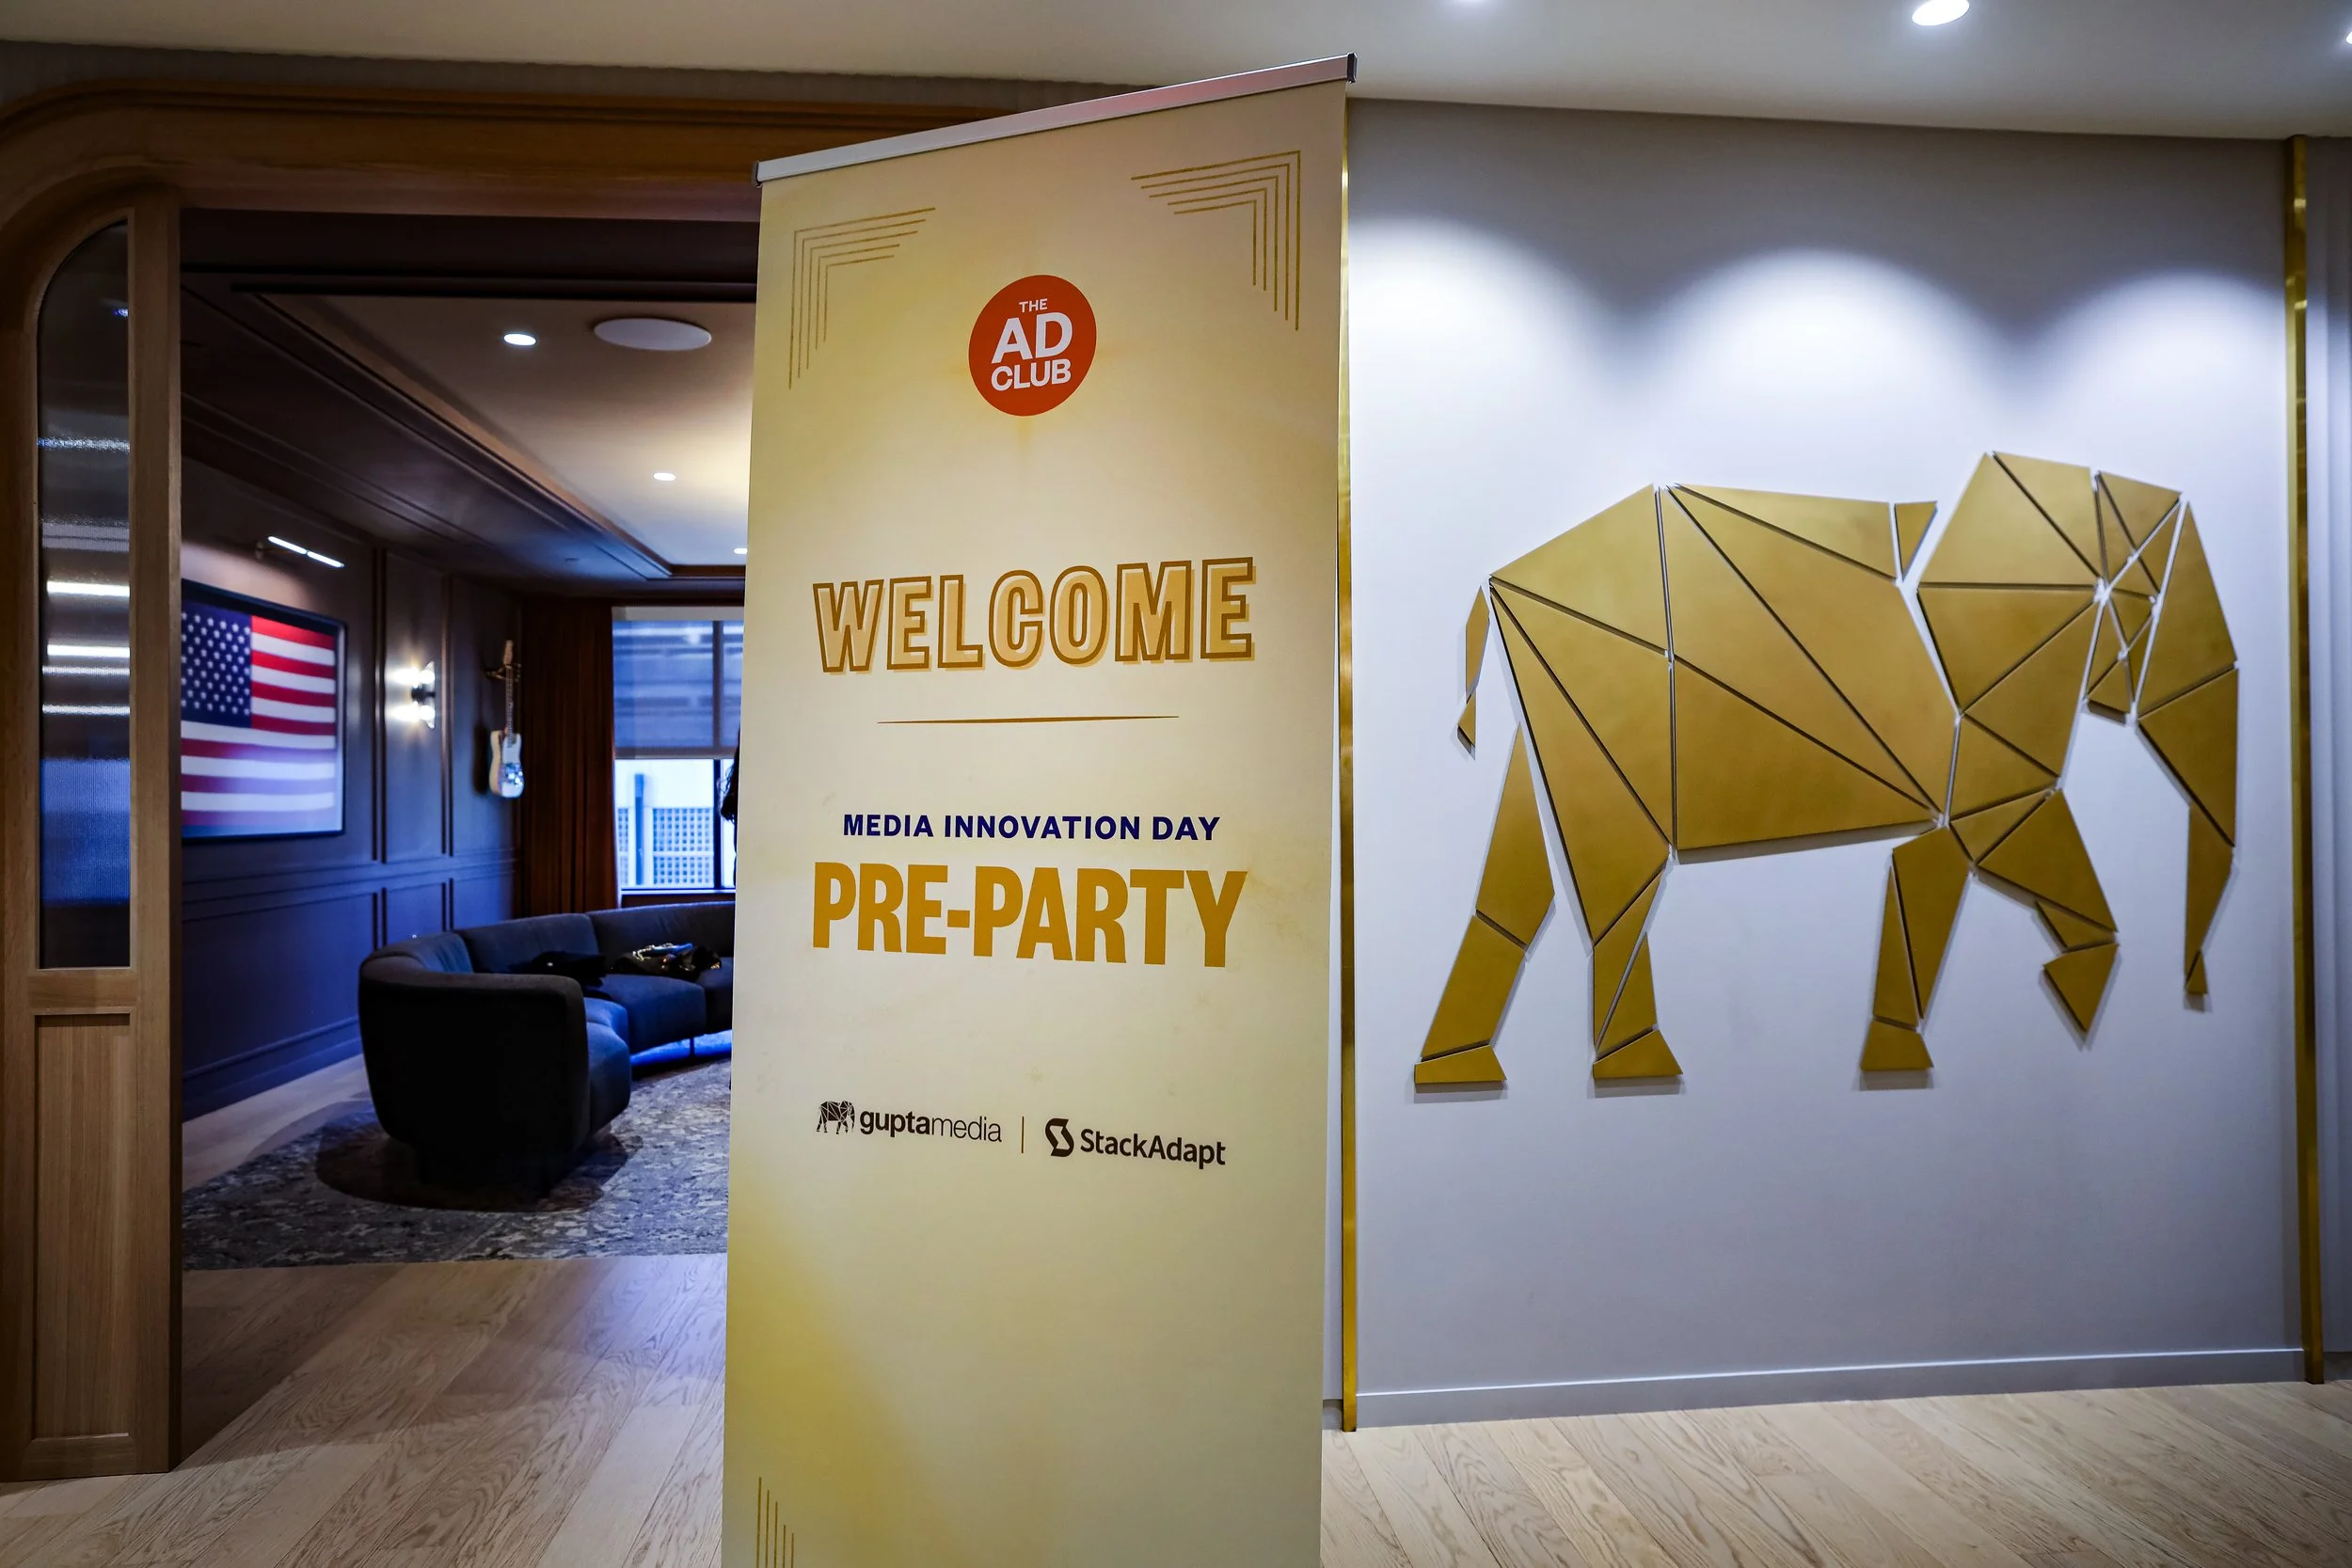
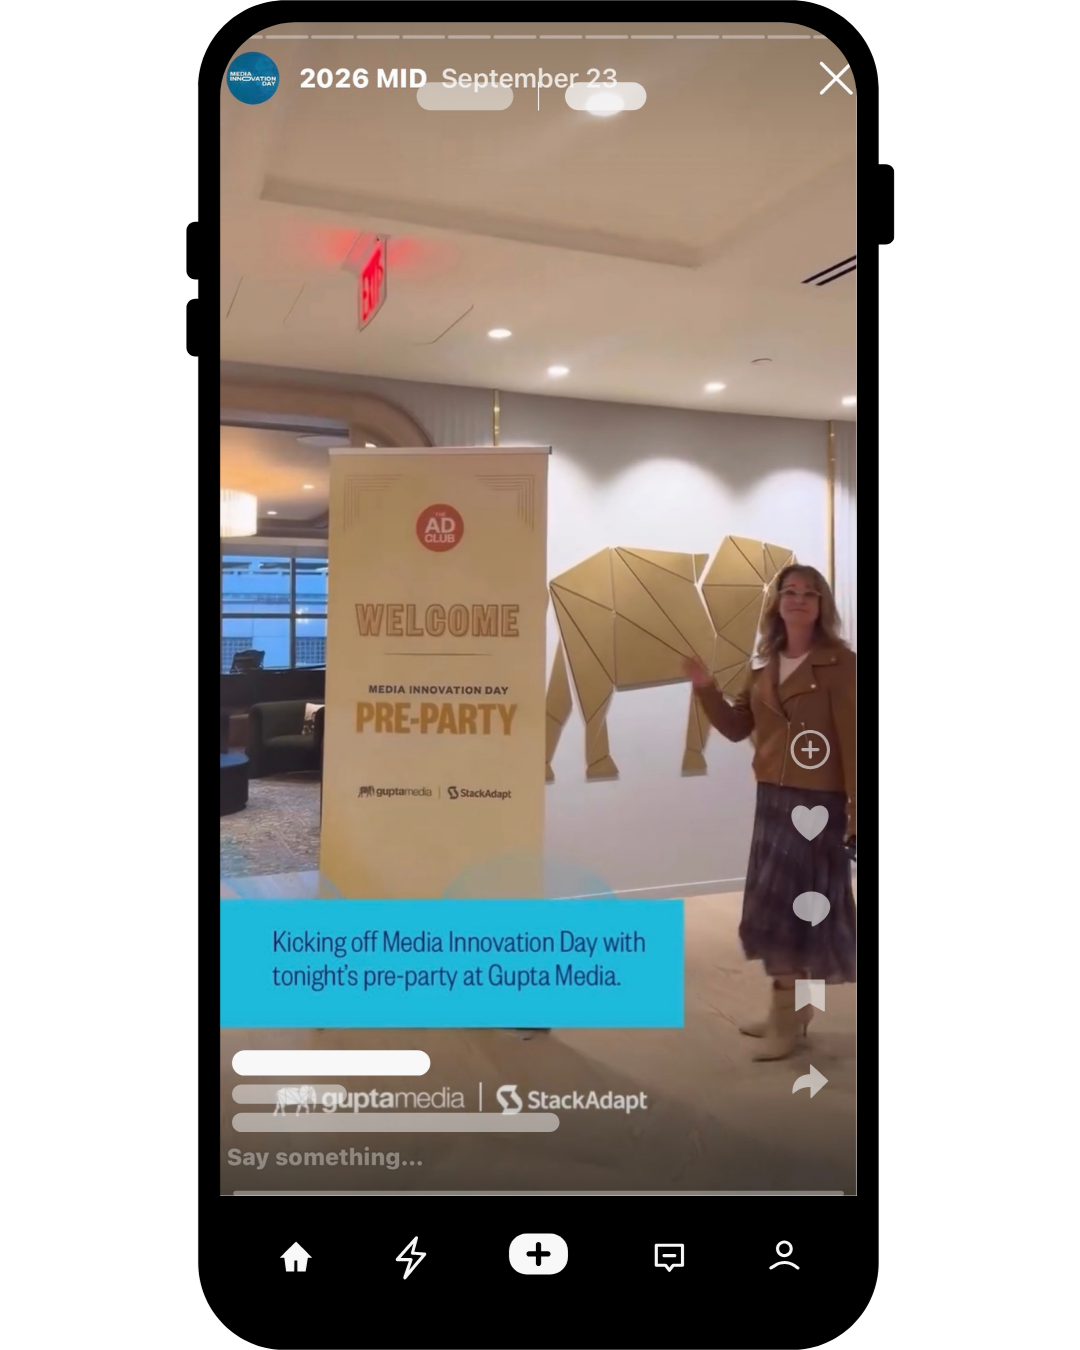
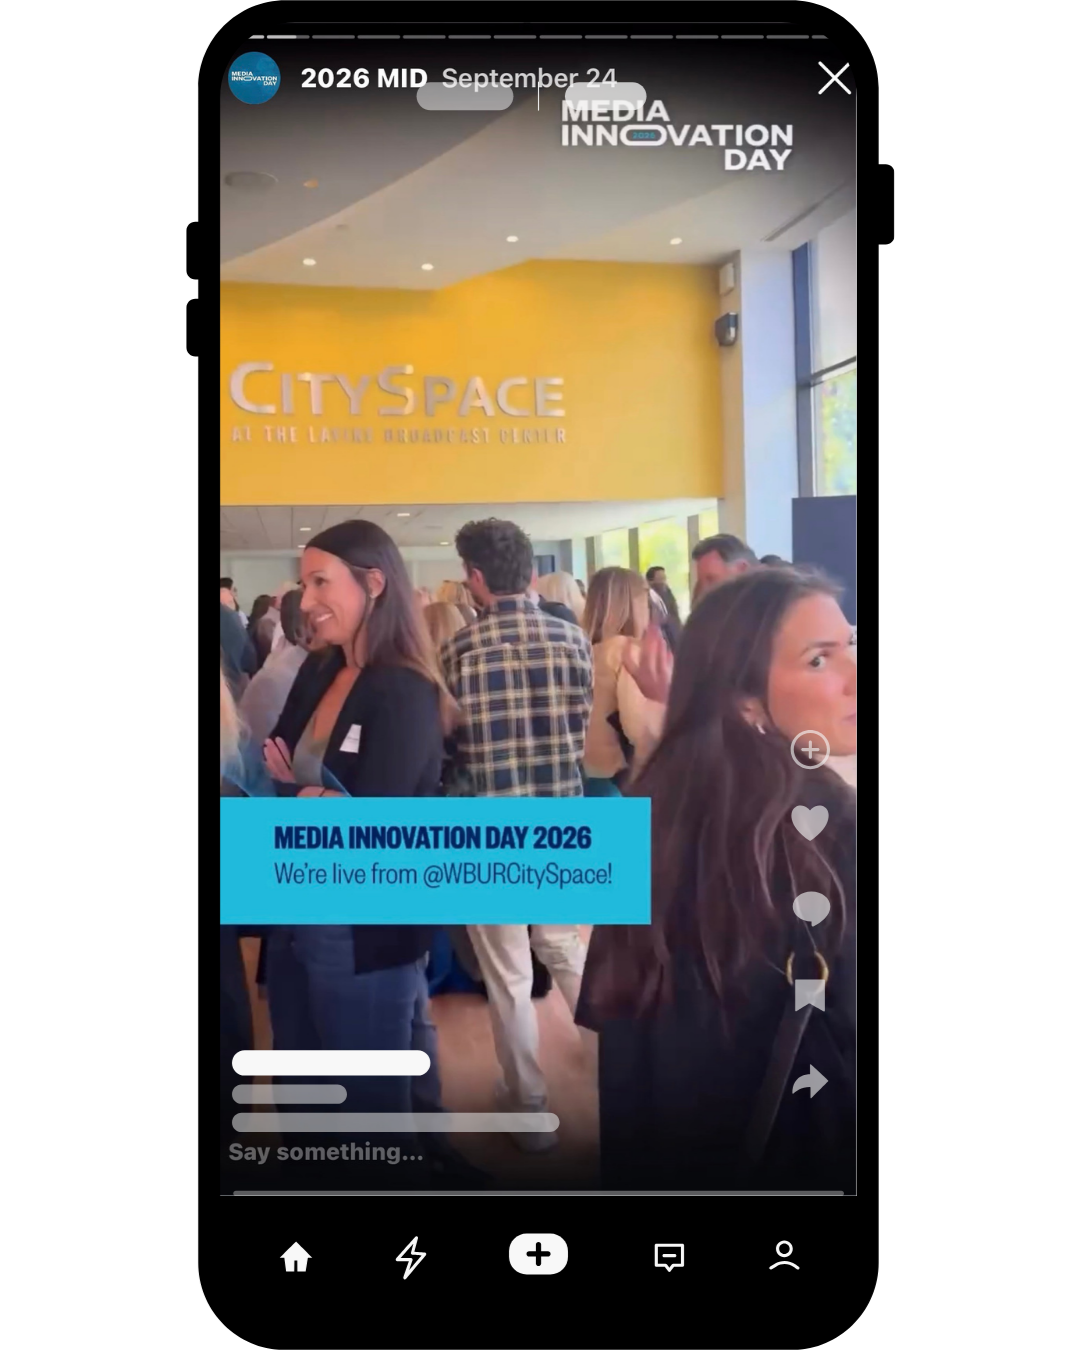
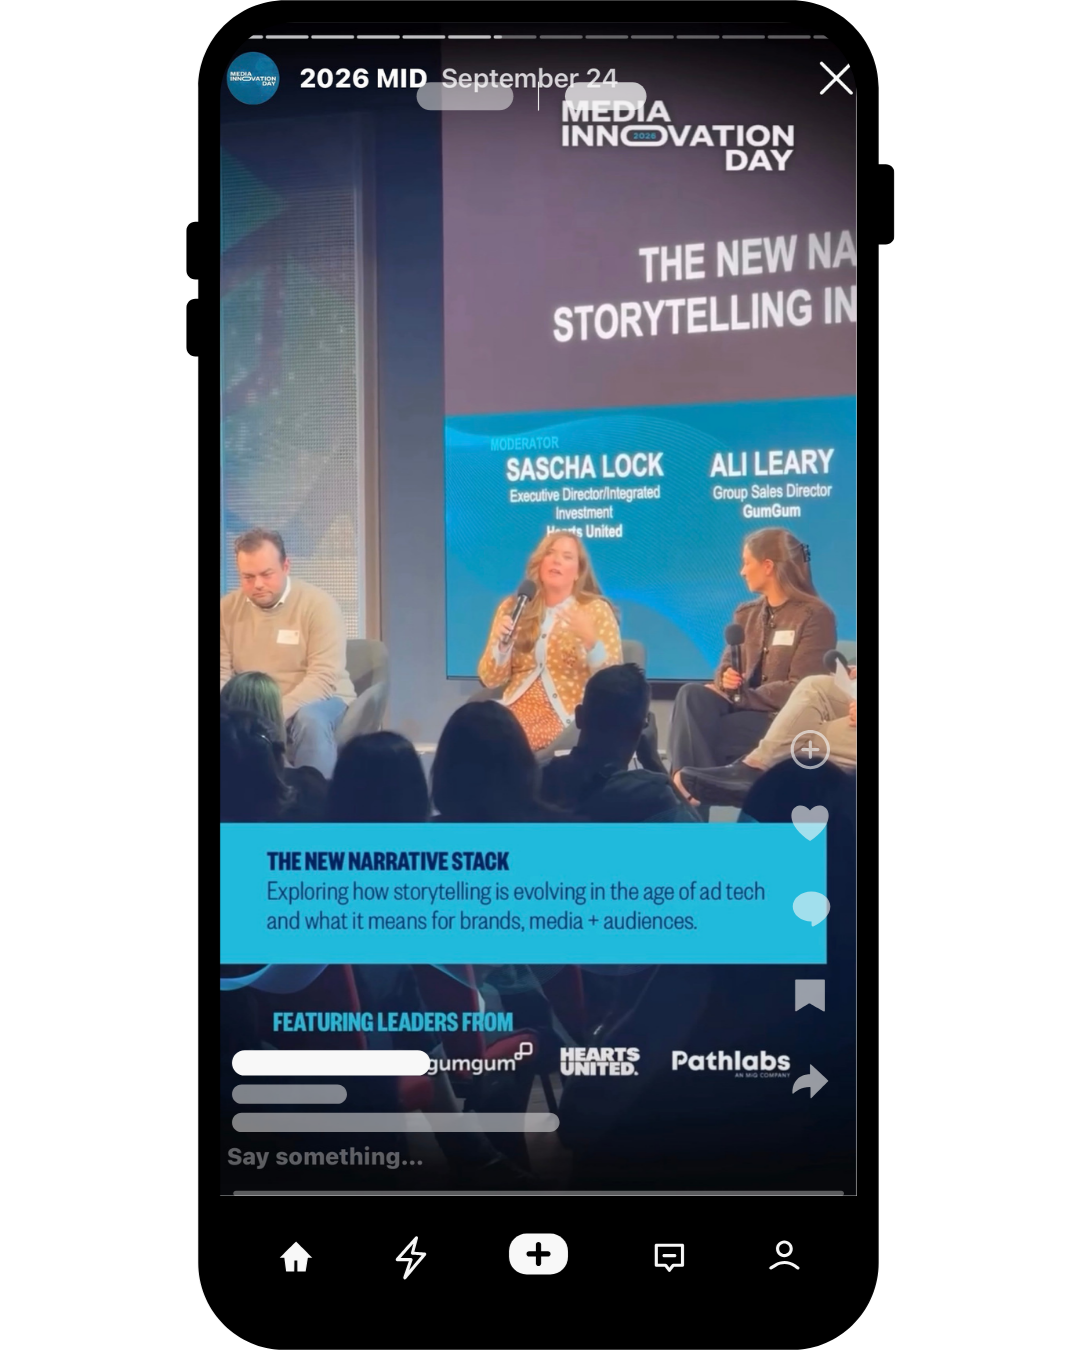
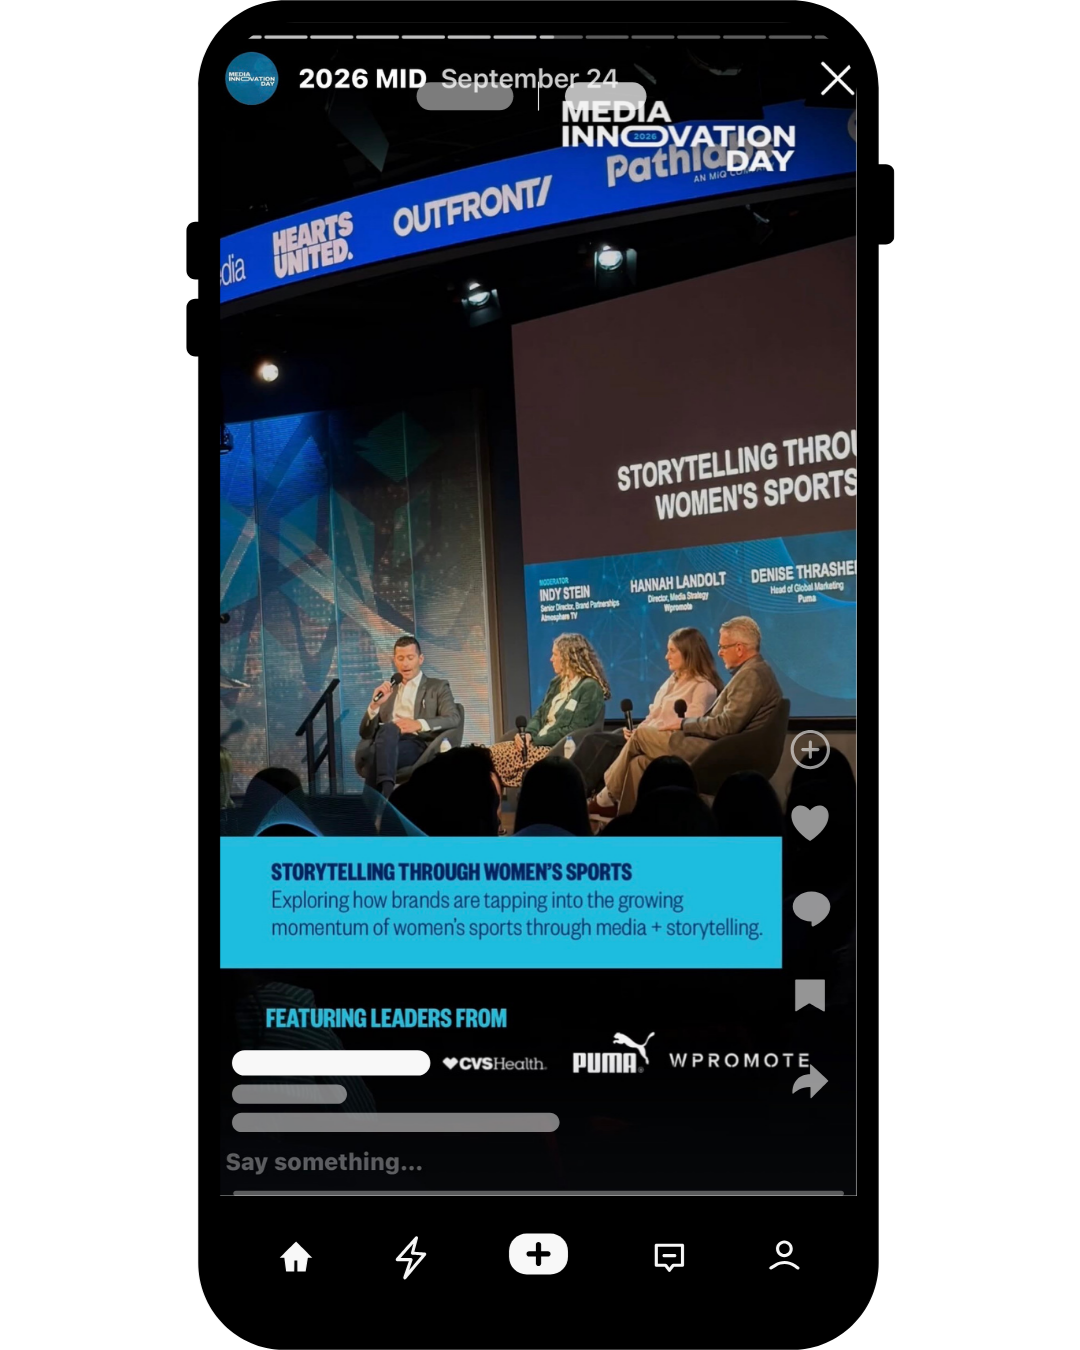
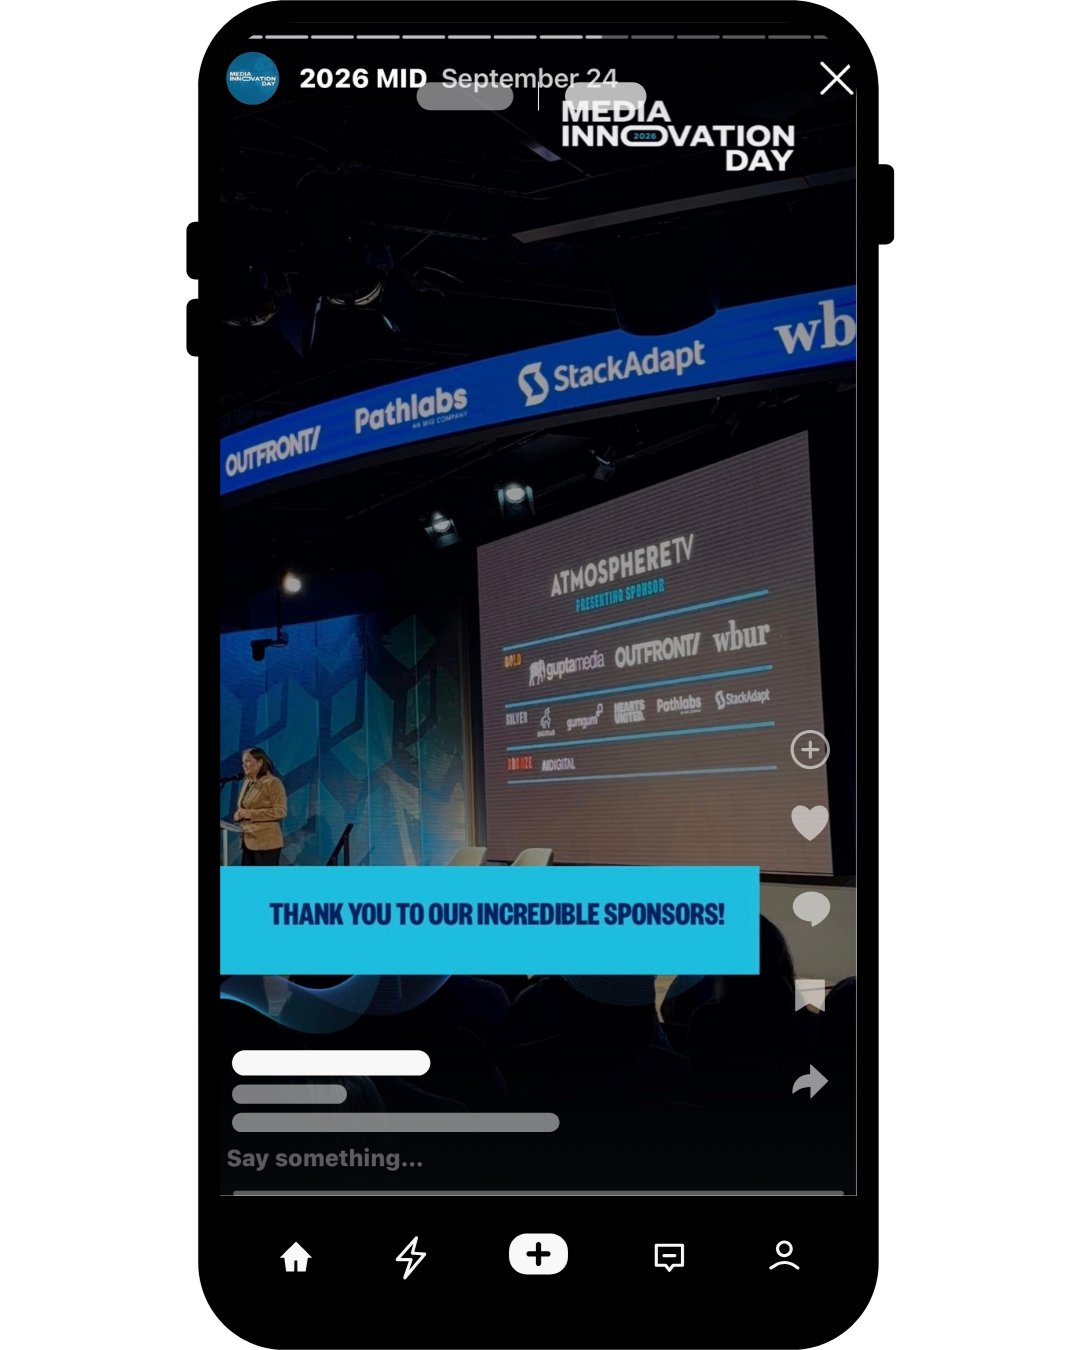
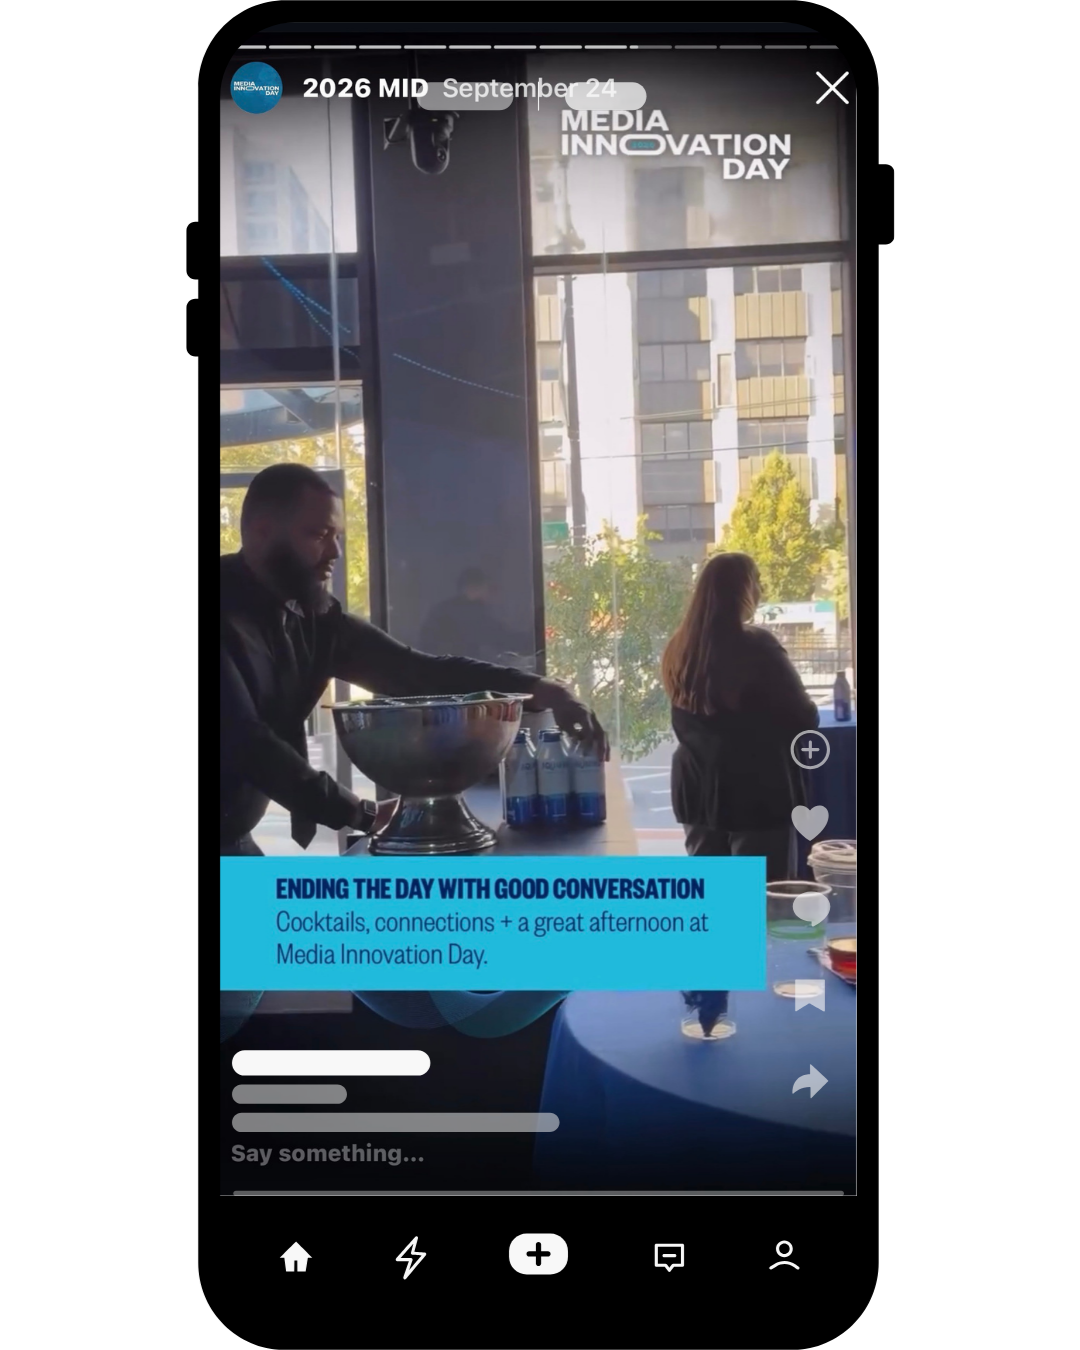
At The Ad Club, I supported the event’s promotion and attendee engagement through social media, email campaigns, website updates, and on-site materials. My work included promotional graphics, speaker highlights, event signage, live social coverage, and post-event recaps, helping connect audiences with the event before, during, and after it took place.
Campaign Performance
Instagram Performance
2025 vs. 2026
| Feed metric | 2025 | 2026 | Change |
|---|---|---|---|
| Views | 7,613 | 6,714 | −11.8% |
| Combined reach | 2,483 | 4,187 | +68.6% |
| Interactions | 60 | 185 | +208.3% |
| Interaction rate | 2.42% | 4.42% | +2 pp |
Explore more Instagram results
Feed Posts and Reels
| Metric | 2025 | 2026 | Change |
|---|---|---|---|
| Posts | 7 | 7 | 0% |
| Likes | 50 | 150 | +200% |
| Shares | 8 | 22 | +175% |
| Comments | 2 | 10 | +400% |
| Saves | 0 | 3 | +3 |
| Attributed follows | 4 | 2 | −50% |
Event-Day Stories
| Metric | 2025 | 2026 | Change |
|---|---|---|---|
| Stories | 4 | 14 | +10 |
| Views | 908 | 5,615 | +518.4% |
| Combined reach | 672 | 3,863 | +474.9% |
| Average views | 227 | 401 | +76.7% |
| Average reach | 168 | 276 | +64.2% |
Story averages are per Story and rounded. Interaction rate is feed interactions divided by combined feed reach. “pp” means percentage points. Saves increased from zero, so a percentage increase is not calculated.
Seven feed posts in each year. Story coverage increased from four to 14 Stories. Combined reach may count repeat viewers across posts. Lifetime metrics use unmatched measurement periods.
LinkedIn Performance
August 13–October 14, 2026
| Metric | 2026 |
|---|---|
| Reported clicks | 2,959 |
| Social interactions | 219 |
| Likes | 185 |
| Comments | 12 |
| Reposts | 22 |
Social interactions include likes, comments, and reposts. Clicks are platform-reported actions and do not establish website visits or registrations. Comparable 2025 data was unavailable.
Email Campaign Performance
Pre-event and post-event · 2026
| Campaign | Open rate | Click rate |
|---|---|---|
| Ticket Promotion | 42.8% | 8.6% |
| Thank-You & Survey | 74.6% | 10.7% |
| Panels & Videos | 55.8% | 15.5% |
Ticket promotion audience: 9,376 contacts. Post-event audiences: 186–187 contacts. Promotion and survey rates include resend activity; open rates include proxy opens.
The average gives equal weight to each email and is not an audience-weighted overall campaign rate.
Green indicates an increase; red indicates a decrease. LinkedIn and email results remain neutral because no comparable prior-period results are shown.
Creative