Freelance Social Media Management
Client: New Salem General Store
My Role & Impact
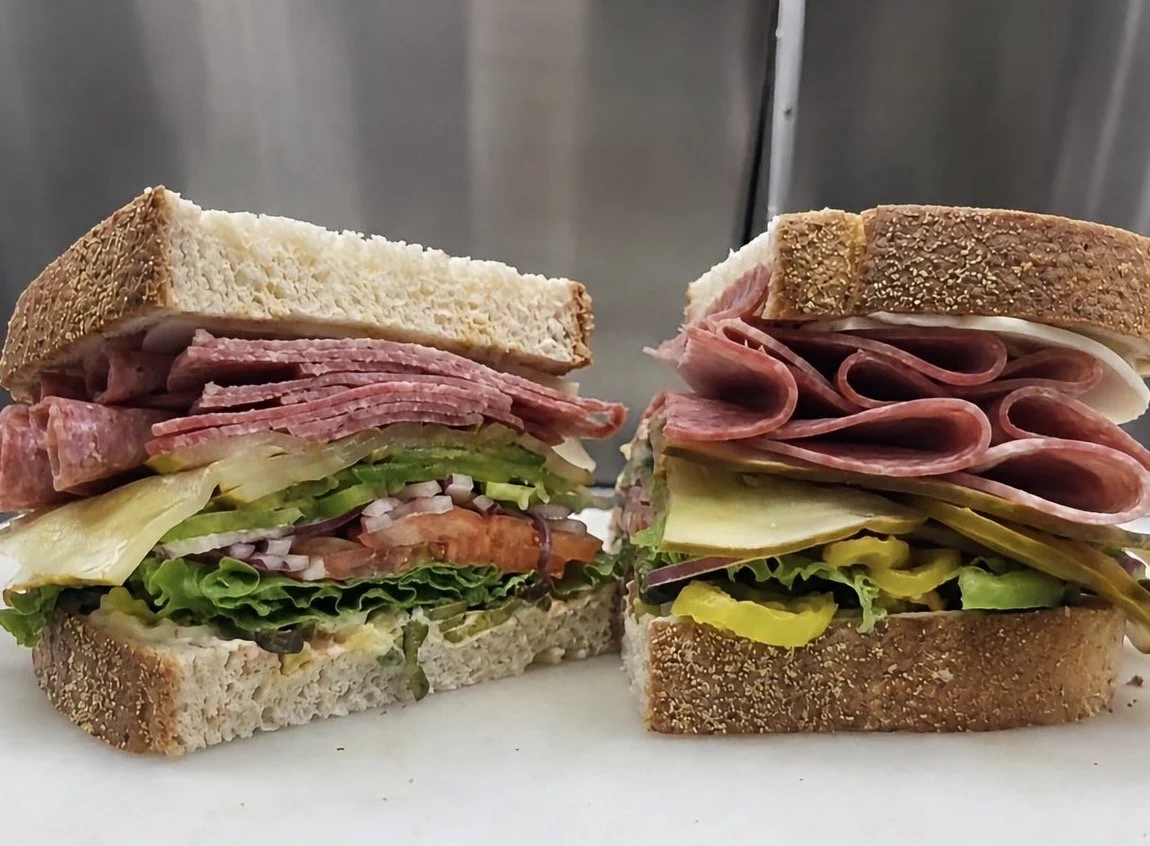
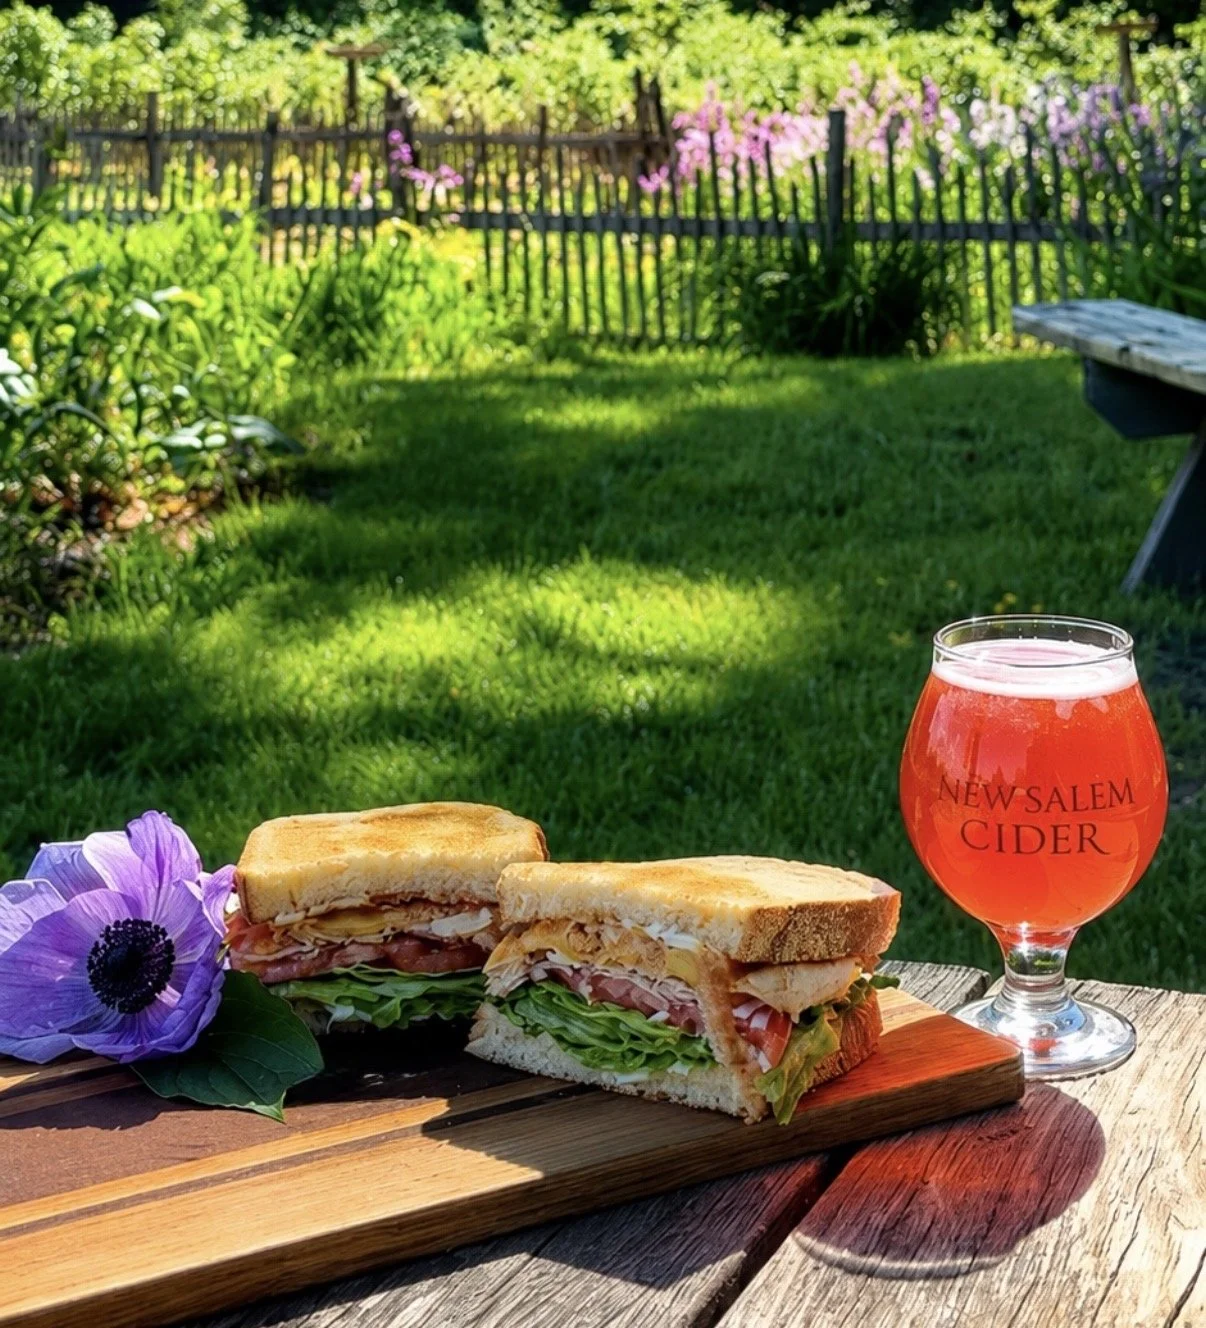
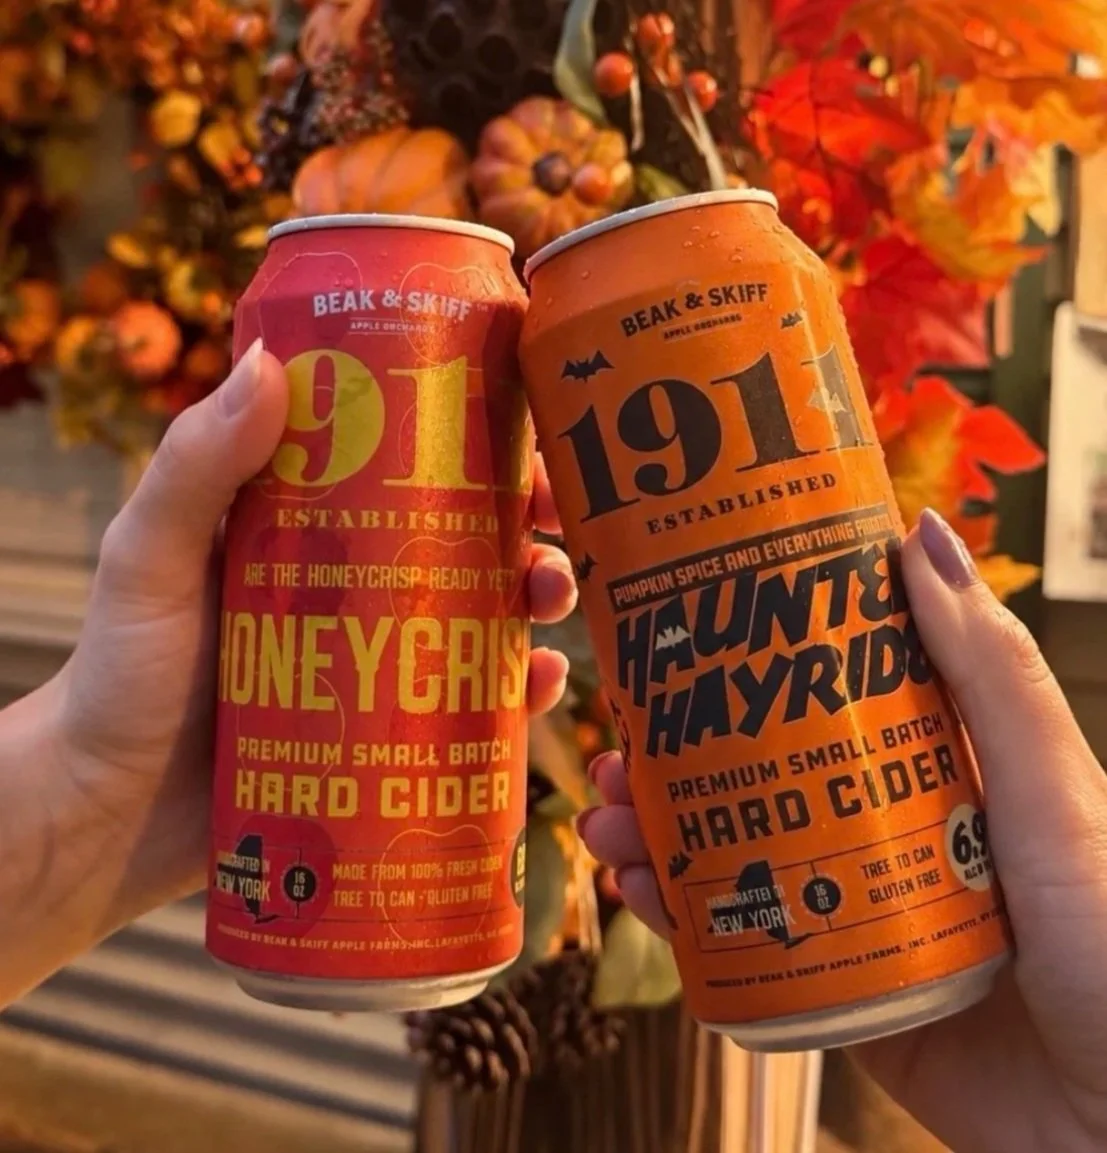
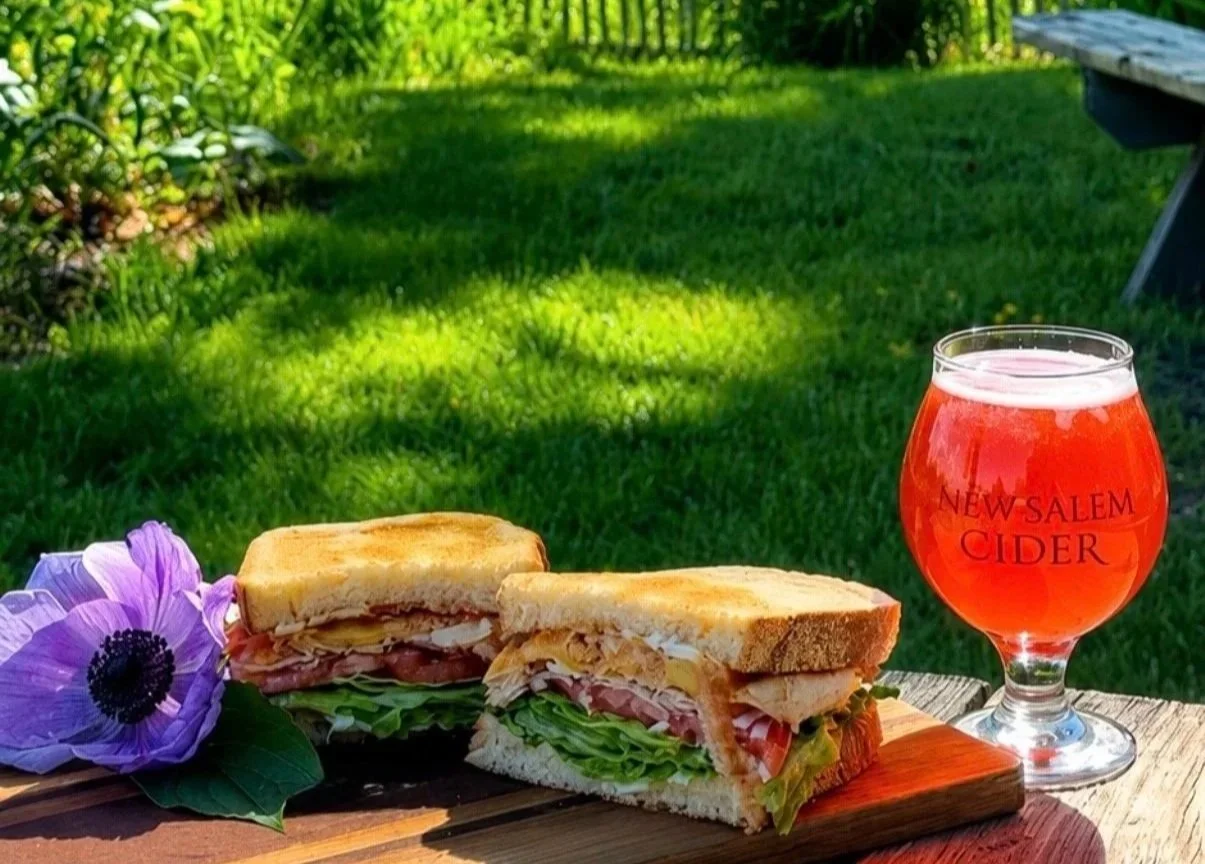
Since October 2025, I have managed social media for New Salem General Store across Facebook, Instagram, and TikTok. I develop content ideas, film and edit short-form videos, create photography and captions, and promote seasonal offerings through local storytelling.
My role also includes developing local micro-influencer partnerships and managing reviews, comments, and direct messages. During my first year working with the store, Facebook post views nearly doubled and interactions increased 86.0% compared with the previous year. The Facebook audience grew 16.3%, from 4,120 to 4,792 followers, while Instagram grew 16.1%, from 948 to 1,101 followers. I also launched its TikTok account and grew it from zero to 489 followers.
4,120 → 4,792 followers
948 → 1,101 followers
Post-performance growth compares lifetime results for posts published in October 2024–October 2025 with October 2025–October 2026. The earlier period represents activity before my involvement. Follower growth covers October 1, 2025–October 1, 2026 and accounts for unfollows. Year-end follower totals are calculated from starting counts plus net follower gains.
Social Media Results
Facebook Performance · 2024–2025 vs. 2025–2026
| Metric |
Oct. 2024–Oct. 2025 Before my involvement |
Oct. 2025–Oct. 2026 First year of client work |
Change |
|---|---|---|---|
| Posts | 39 | 54 | +38.5% |
| Views | 173,658 | 346,578 | +99.6% |
| Reactions | 4,075 | 7,998 | +96.3% |
| Comments | 537 | 711 | +32.4% |
| Shares | 435 | 677 | +55.6% |
| Total interactions | 5,047 | 9,386 | +86.0% |
| Average views per post | 4,452.8 | 6,418.1 | +44.1% |
| Average interactions per post | 129.4 | 173.8 | +34.3% |
| New follows | 433 | 782 | +80.6% |
| Unfollows | 77 | 110 | +42.9% |
| Net followers gained | 356 | 672 | +88.8% |
| Followers at start of client year | — | 4,120 | — |
| Calculated followers at year end | — | 4,792 | — |
| Audience growth during client year | — | +16.3% | — |
Facebook interactions include reactions, comments, and shares. Both average views and average interactions per post increased alongside publishing volume. Net followers gained equals new follows minus unfollows. Net gains rose from 356 to 672, an 88.8% increase over the previous year.
Starting from 4,120 followers, the net gain of 672 gives a calculated year-end audience of 4,792 and 16.3% audience growth.
Instagram Performance · 2024–2025 vs. 2025–2026
| Metric |
Oct. 2024–Oct. 2025 Before my involvement |
Oct. 2025–Oct. 2026 First year of client work |
Change |
|---|---|---|---|
| Posts | 4 | 50 | +1,150.0% |
| Views | 11,657 | 39,253 | +236.7% |
| Likes | 254 | 1,869 | +635.8% |
| Comments | 27 | 94 | +248.1% |
| Shares | 66 | 120 | +81.8% |
| Saves | 1 | 36 | +3,500.0% |
| Total interactions | 348 | 2,119 | +508.9% |
| Average views per post | 2,914.3 | 785.1 | −73.1% |
| Average interactions per post | 87.0 | 42.4 | −51.3% |
| New follows | Unavailable | 217 | — |
| Unfollows | Unavailable | 64 | — |
| Net followers gained | Unavailable | 153 | — |
| Followers at start of client year | — | 948 | — |
| Calculated followers at year end | — | 1,101 | — |
| Audience growth during client year | — | +16.1% | — |
Instagram interactions include likes, comments, shares, and saves. The baseline contains only four posts, including a creator-published reel with 7,673 views. Both periods include creator-published posts present in the exports. The small baseline and different content mix affect comparisons of totals and averages.
Instagram gained 217 follows and recorded 64 unfollows, for a net gain of 153. Starting from 948 followers, this gives a calculated year-end audience of 1,101 and 16.1% audience growth. Earlier-year audience data is unavailable, so no year-over-year comparison of new follows is calculated.
TikTok Performance · Account Launch & Growth
| Metric | Result |
|---|---|
| Starting followers | 0 |
| Followers | 489 |
| Total likes | 1,527 |
I launched the account from zero and built its audience through original short-form content.
Post rows summarize lifetime metrics for posts published within each comparison window, rather than account activity measured only during those dates. Results include all posts in the supplied exports and may include activity after the publication windows. Older posts have had longer to accumulate results. Audience rows measure follows and unfollows within the selected annual date ranges.
Creator Partnerships & Community Engagement
I develop local micro-influencer partnerships to introduce the store to new audiences and highlight its connection to the surrounding community. My work also includes managing reviews, comments, and direct messages to maintain an active and responsive social presence.
Social Content
Selected videos I created to highlight seasonal favorites, local experiences, and everyday moments at New Salem General Store.